EX-99.2
Published on November 15, 2022
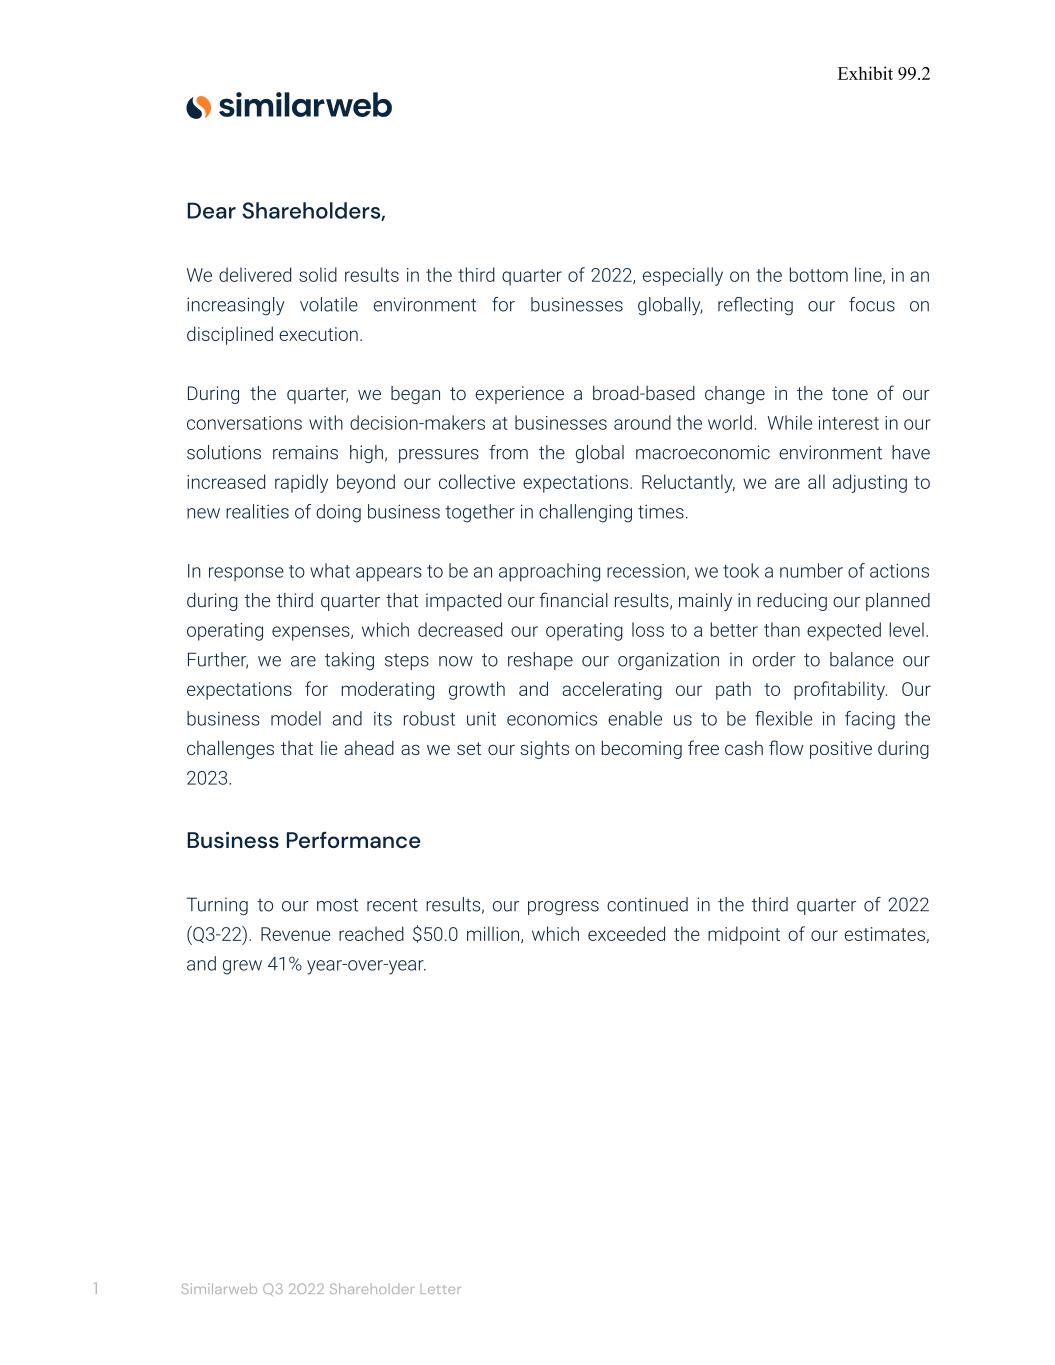
Exhibit 99.2 Dear Shareholders, We delivered solid results in the third quarter of 2022, especially on the bottom line, in an increasingly volatile environment for businesses globally, reflecting our focus on disciplined execution. During the quarter, we began to experience a broad-based change in the tone of our conversations with decision-makers at businesses around the world. While interest in our solutions remains high, pressures from the global macroeconomic environment have increased rapidly beyond our collective expectations. Reluctantly, we are all adjusting to new realities of doing business together in challenging times. In response to what appears to be an approaching recession, we took a number of actions during the third quarter that impacted our financial results, mainly in reducing our planned operating expenses, which decreased our operating loss to a better than expected level. Further, we are taking steps now to reshape our organization in order to balance our expectations for moderating growth and accelerating our path to profitability. Our business model and its robust unit economics enable us to be flexible in facing the challenges that lie ahead as we set our sights on becoming free cash flow positive during 2023. Business Performance Turning to our most recent results, our progress continued in the third quarter of 2022 (Q3-22). Revenue reached $50.0 million, which exceeded the midpoint of our estimates, and grew 41% year-over-year. 1 Similarweb Q3 2022 Shareholder Letter
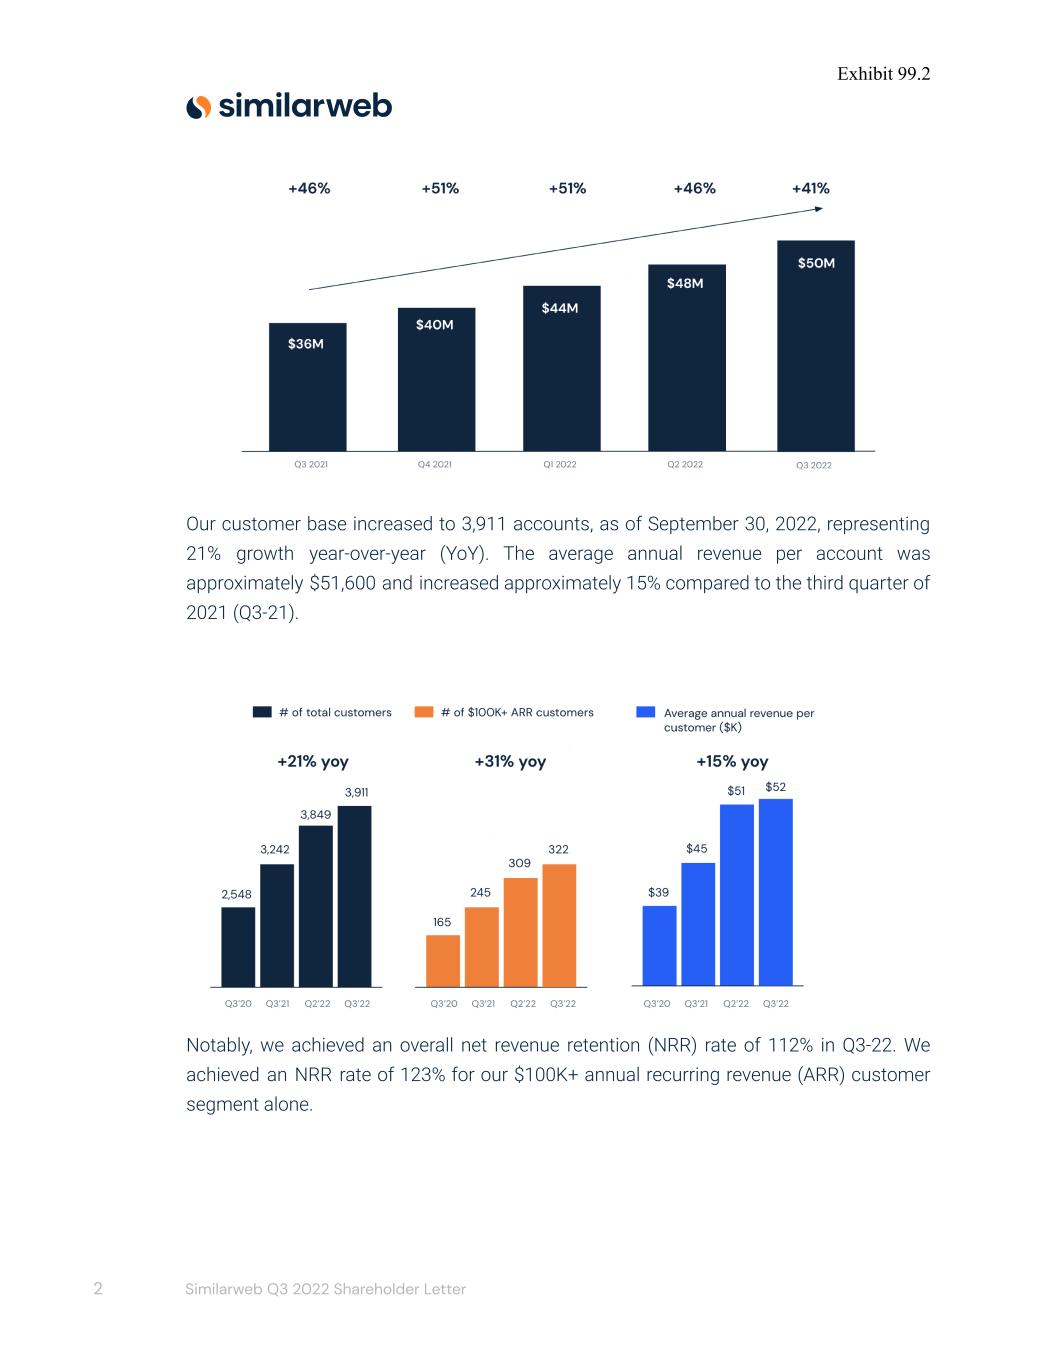
Exhibit 99.2 Our customer base increased to 3,911 accounts, as of September 30, 2022, representing 21% growth year-over-year (YoY). The average annual revenue per account was approximately $51,600 and increased approximately 15% compared to the third quarter of 2021 (Q3-21). Notably, we achieved an overall net revenue retention (NRR) rate of 112% in Q3-22. We achieved an NRR rate of 123% for our $100K+ annual recurring revenue (ARR) customer segment alone. 2 Similarweb Q3 2022 Shareholder Letter
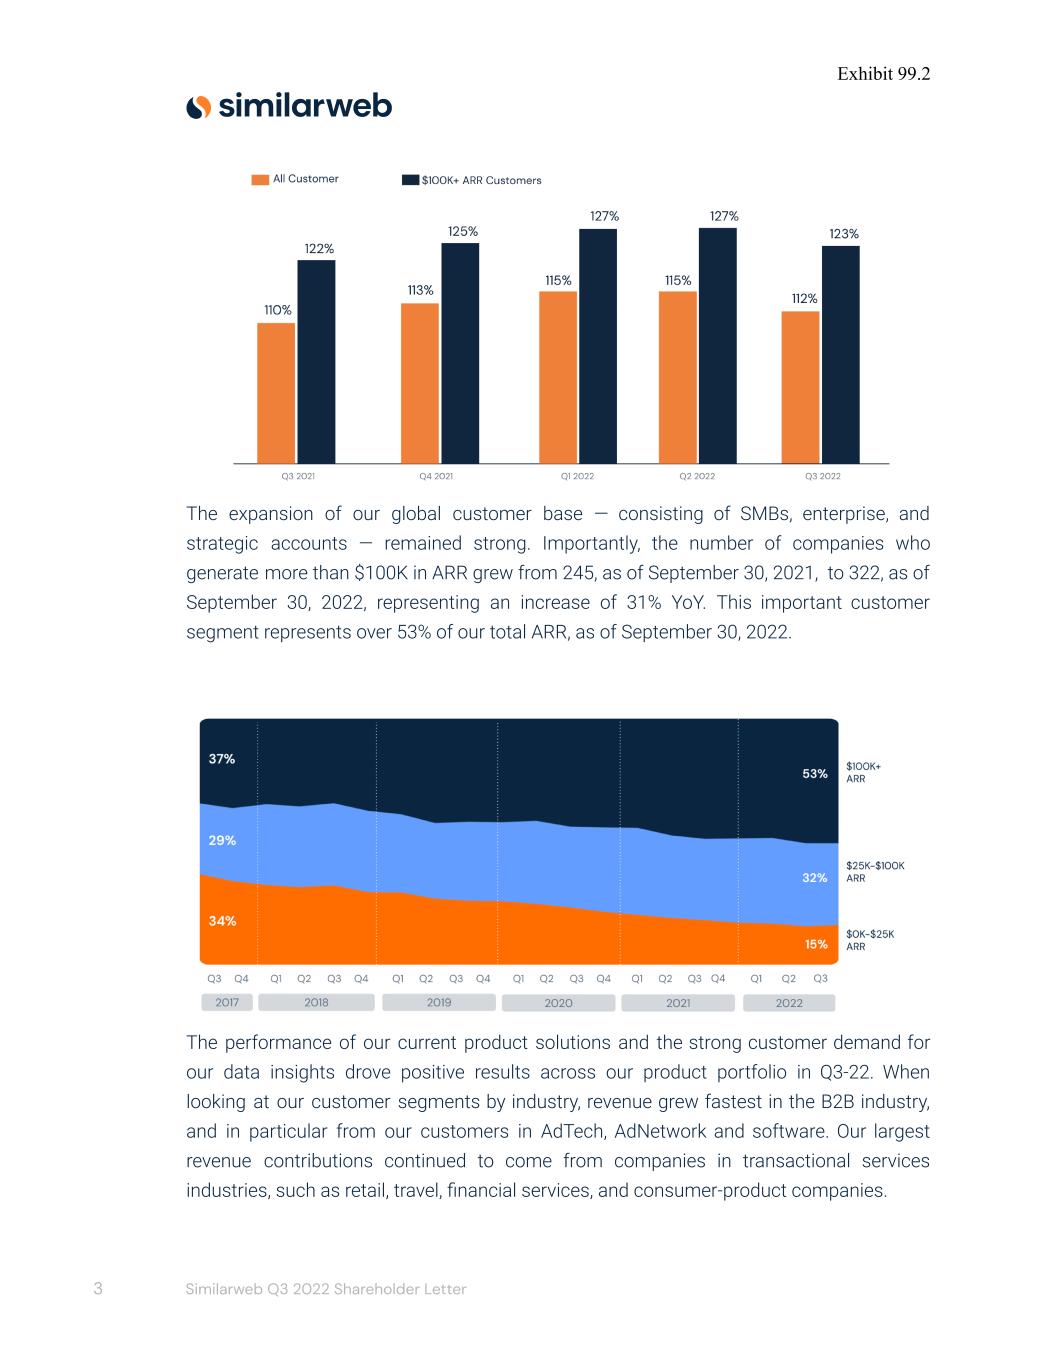
Exhibit 99.2 The expansion of our global customer base — consisting of SMBs, enterprise, and strategic accounts — remained strong. Importantly, the number of companies who generate more than $100K in ARR grew from 245, as of September 30, 2021, to 322, as of September 30, 2022, representing an increase of 31% YoY. This important customer segment represents over 53% of our total ARR, as of September 30, 2022. The performance of our current product solutions and the strong customer demand for our data insights drove positive results across our product portfolio in Q3-22. When looking at our customer segments by industry, revenue grew fastest in the B2B industry, and in particular from our customers in AdTech, AdNetwork and software. Our largest revenue contributions continued to come from companies in transactional services industries, such as retail, travel, financial services, and consumer-product companies. 3 Similarweb Q3 2022 Shareholder Letter
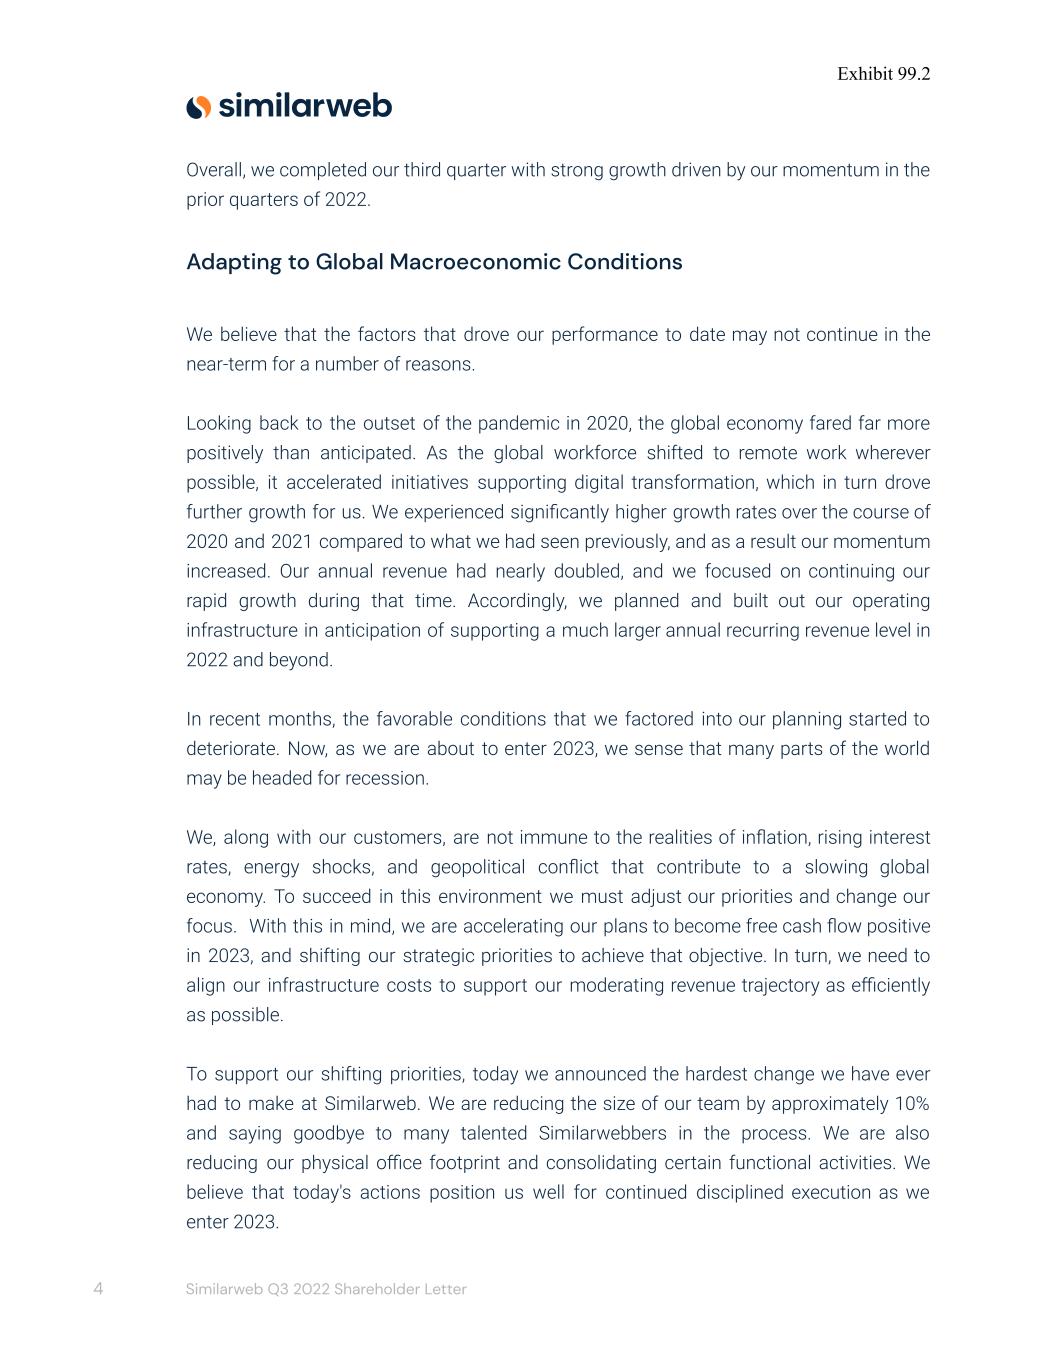
Exhibit 99.2 Overall, we completed our third quarter with strong growth driven by our momentum in the prior quarters of 2022. Adapting to Global Macroeconomic Conditions We believe that the factors that drove our performance to date may not continue in the near-term for a number of reasons. Looking back to the outset of the pandemic in 2020, the global economy fared far more positively than anticipated. As the global workforce shifted to remote work wherever possible, it accelerated initiatives supporting digital transformation, which in turn drove further growth for us. We experienced significantly higher growth rates over the course of 2020 and 2021 compared to what we had seen previously, and as a result our momentum increased. Our annual revenue had nearly doubled, and we focused on continuing our rapid growth during that time. Accordingly, we planned and built out our operating infrastructure in anticipation of supporting a much larger annual recurring revenue level in 2022 and beyond. In recent months, the favorable conditions that we factored into our planning started to deteriorate. Now, as we are about to enter 2023, we sense that many parts of the world may be headed for recession. We, along with our customers, are not immune to the realities of inflation, rising interest rates, energy shocks, and geopolitical conflict that contribute to a slowing global economy. To succeed in this environment we must adjust our priorities and change our focus. With this in mind, we are accelerating our plans to become free cash flow positive in 2023, and shifting our strategic priorities to achieve that objective. In turn, we need to align our infrastructure costs to support our moderating revenue trajectory as efficiently as possible. To support our shifting priorities, today we announced the hardest change we have ever had to make at Similarweb. We are reducing the size of our team by approximately 10% and saying goodbye to many talented Similarwebbers in the process. We are also reducing our physical office footprint and consolidating certain functional activities. We believe that today's actions position us well for continued disciplined execution as we enter 2023. 4 Similarweb Q3 2022 Shareholder Letter
Exhibit 99.2 Strategy & Execution As we move forward, we will be working smarter and focusing our efforts to endure leaner times. We always execute in a disciplined manner, and we believe this attribute is important to our current and future success. While we will be prioritizing our innovation initiatives differently than in the recent past to optimize our resources, our strategy will remain unchanged. Our overall strategy still consists of three pillars we strive to implement: 1. Establishing, maintaining, and enhancing substantial advantages in data and technology 2. Delivering considerable return on investment for our customers through our digital intelligence solutions 3. Executing our go-to-market strategies, catalyzed by smart investments and operational discipline We believe that our capabilities in detecting and understanding online behavior from an “outside-in” perspective are exceptional. One of the most definitive examples of our ability is on display in our research on Twitter that we published this quarter. The previous leadership team at Twitter had stated that they believed there was no way to determine the amount of bots (non-human programs posing as humans) on their platform compared to humans. Rising to this challenge, our data scientists found that bots on Twitter represent a small part of Twitter’s user base, and that a significant portion of Twitter’s content is created by bots. This finding was counter to the thesis that the activity could not be determined, and further, disproved the assertion by Elon Musk that bots were a meaningful percentage of Twitter users. We believe we are the only entity operating in the digital world that has the proprietary technology and ability to achieve these findings. Using this proprietary technology, we create compelling solutions that help leaders in sales, digital marketing, market research, and ecommerce strategy get results. Our solutions contain easy-to-understand insights that guide companies on what they can do in order to gain market share. Notably, our solutions apply to a wide variety of industries, ranging from financial services to retail, travel, CPGs, media, and others. We recently shared an example of our tremendous visibility into the performance of goods within 5 Similarweb Q3 2022 Shareholder Letter
Exhibit 99.2 online marketplaces such as Amazon, where our analysis of Prime Day Early Access compared to Prime Day validated suspected softening in the consumer economy. In addition to company driven solutions, we provide reliable and timely alternative data for the investment community that help investors make informed decisions on companies and their strategies. We continue to aggressively test and learn with beta users of our forthcoming Stock Intelligence Solution module that we will expect to launch at the end of this year. We believe our software-as-a-service (SaaS) solutions disrupt and redefine the category of online market research and intelligence. Without our solutions, it can take weeks or months to research, benchmark, and analyze companies, industries and markets at a substantial cost. Using our software, our customers can reduce the time it takes to access actionable insights to hours, minutes, or even seconds utilizing our relevant solutions. Now, in response to the requests of many companies who want fully integrated access to our data and insights, we are evolving further. We are taking major steps forward to build our data-as-a-service (DaaS) offering that many large enterprises and complementary solutions providers will benefit from. We recently announced our DaaS partnership with EDO that combines our data and insights with EDO’s capabilities in the convergent television ecosystem (broadcast + cable + streaming), one of many exciting initiatives ahead. We provide valuable market visibility to our customers who repeatedly tell us that we are a major contributing factor to their success in this uncertain environment. Our customers increasingly rely on our technological solutions to operate and grow, especially during challenging times. Companies continue to invest smartly in digital transformation, to make more data-driven decisions, and to prepare for the ramifications of data privacy evolutions. Importantly, our digital intelligence solutions remain critical enablement tools for our customers to understand their markets better than their competitors, to act faster, and to win in today’s online world. Financial Results When examining our financial results, please note that references to expenses and operating results (other than revenue) are presented both on a GAAP and on a non-GAAP 6 Similarweb Q3 2022 Shareholder Letter
Exhibit 99.2 basis below, and that all non-GAAP results are reconciled to the most directly comparable GAAP results in the financial statements exhibits presented at the end of this letter. Our financial results in Q3-22 met our top line projections and exceeded our estimates on the bottom line. Revisiting our top line results, in Q3-22, we delivered strong revenues of $50.0 million, reflecting a 41% YoY growth driven by increases in customers and revenue per customer. 52% of our sales came from international markets outside of the United States. Approximately 99% of our revenue is annual recurring revenue (ARR) with minimum subscription terms of one year. We continue to increase the number of customers with multi-year subscription terms. As of the end of Q3-22, 37% of our ARR was generated from customers with multi-year subscription commitments, compared to 31% at the same time last year. We believe this is a strong indicator of the long-term durability of demand for our platform. Our GAAP gross profit totaled $36.3 million and our non-GAAP gross profit totaled $38.1 million in Q3-22, compared to $27.8 million and $27.9 million in Q3-21, respectively. Non-GAAP gross margin was 76.2% in Q3-22, versus 78.3% in Q3-21. To analyze gross margin on a comparable basis, the impact from the Embee Mobile acquisition and data.ai partnership on gross margin in Q3-22 was approximately 4.3 percentage points. Because these expenses are almost entirely fixed, we expect the negative impact on gross margin will decrease as revenue increases in future periods. GAAP operating expenses grew to $56.9 million and our non-GAAP operating expenses grew to $51.4 million in Q3-22, up from $44.5 million and $41.7 million in Q3-21, respectively, largely reflecting the investment in human capital across the business to support our growth. Non-GAAP operating expenses represented 102.8% of revenue in Q3-22 as compared to 117.2% of revenue in Q3-21, demonstrating the efficiency of our unit economics and our disciplined execution. Specific components of our operating expenses: Our GAAP research and development investment increased to $15.2 million and our non-GAAP research and development investment increased to $13.7 million in Q3-22, up 7 Similarweb Q3 2022 Shareholder Letter
Exhibit 99.2 from $11.4 million and $10.4 million in Q3-21, respectively. This increase was driven primarily by growth of employee headcount focused on our newer revenue-generating solutions: Shopper Intelligence, Sales Intelligence, and Investor Intelligence. As a percentage of revenue, non-GAAP research & development expense was 27.4% in Q3-22, as compared to 29.3% in Q3-21, an improvement of 1.9 percentage points. GAAP sales and marketing grew to $30.1 million and non-GAAP sales and marketing grew to $27.6 million in Q3-22, up from $24.2 million and $23.2 million in Q3-21, respectively, driven principally by increased headcount in sales and account management, as well as increased marketing activities. As a percentage of revenue, non-GAAP sales & marketing expense was 55.2% in Q3-22, as compared to 65.1% in Q3-21, an improvement of nearly 10.0 percentage points. An operating tenet in our model is that our sales and marketing costs are divided approximately 55% to 60% to customer acquisition (land), and 40% to 45% to retention, upselling and cross-selling (expand). When analyzing our investment in customer acquisition costs (CAC) for growth efficiency, we track an estimated payback period. This metric has historically averaged between 15 and 16 months on a gross profit basis over the trailing four quarters. Currently, the average payback is ranging between 17 and 18 months, primarily due to the longer sales cycles in the current environment, which we expect will normalize as our cost reductions are implemented. For comparability, we adjust for the impact of the Embee Mobile acquisition and data.ai partnership in computing the CAC payback period. Payback from expansion and customer retention costs (CRC) is faster than payback on new customer CAC and contributes meaningfully to our growth efficiency. We continue to invest in customer acquisition to support future growth, as well as in CRC based on our strong NRR and increasing customer lifetime value. GAAP general and administrative costs grew to $11.7 million and our non-GAAP general and administrative costs grew to $10.1 million in Q3-22, up from $9.0 million and $8.1 million in Q3-21, respectively, which was driven by headcount increases to support growth, as well as by expenses incurred as a publicly traded company and our new headquarters in Israel, which we occupied in July 2022. As a percentage of revenue, non-GAAP general & administrative expense was 20.2% in Q3-22, as compared to 22.8% in Q3-21, an improvement of 2.6 percentage points. 8 Similarweb Q3 2022 Shareholder Letter
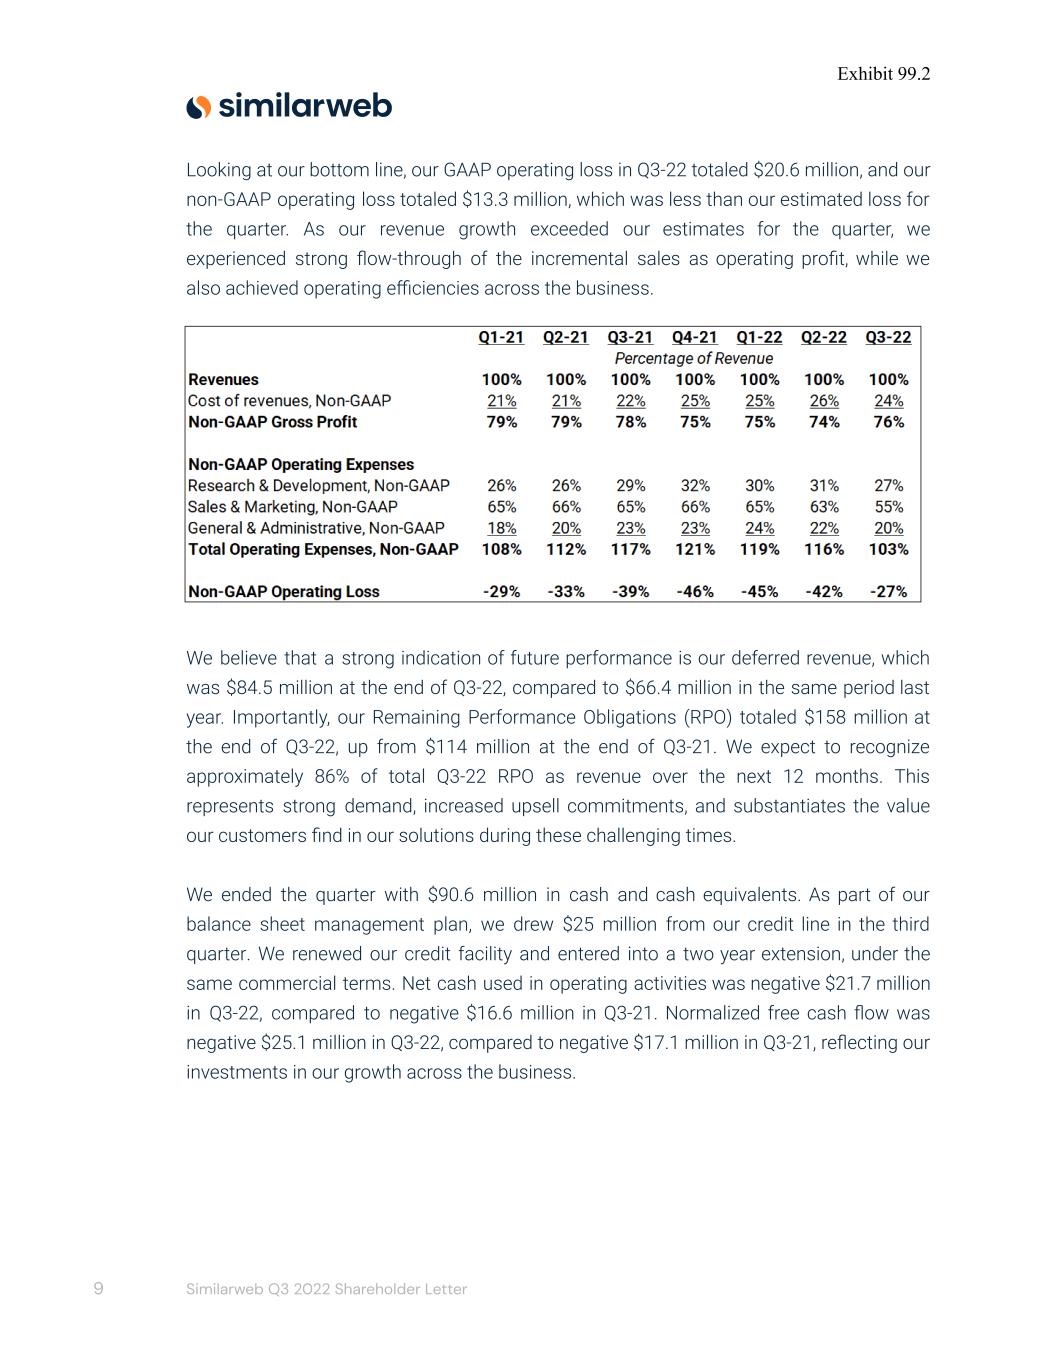
Exhibit 99.2 Looking at our bottom line, our GAAP operating loss in Q3-22 totaled $20.6 million, and our non-GAAP operating loss totaled $13.3 million, which was less than our estimated loss for the quarter. As our revenue growth exceeded our estimates for the quarter, we experienced strong flow-through of the incremental sales as operating profit, while we also achieved operating efficiencies across the business. We believe that a strong indication of future performance is our deferred revenue, which was $84.5 million at the end of Q3-22, compared to $66.4 million in the same period last year. Importantly, our Remaining Performance Obligations (RPO) totaled $158 million at the end of Q3-22, up from $114 million at the end of Q3-21. We expect to recognize approximately 86% of total Q3-22 RPO as revenue over the next 12 months. This represents strong demand, increased upsell commitments, and substantiates the value our customers find in our solutions during these challenging times. We ended the quarter with $90.6 million in cash and cash equivalents. As part of our balance sheet management plan, we drew $25 million from our credit line in the third quarter. We renewed our credit facility and entered into a two year extension, under the same commercial terms. Net cash used in operating activities was negative $21.7 million in Q3-22, compared to negative $16.6 million in Q3-21. Normalized free cash flow was negative $25.1 million in Q3-22, compared to negative $17.1 million in Q3-21, reflecting our investments in our growth across the business. 9 Similarweb Q3 2022 Shareholder Letter
Exhibit 99.2 Business Outlook As we look to the rest of the year, we remain focused on disciplined execution through decisions within our control that relate to managing our balance sheet prudently and supporting both our growth and profitability potential. We are accelerating our plans to become free cash flow positive in 2023. After assessing the traction in our business and its continued likelihood in the current global macroeconomic environment, we are adjusting our revenue guidance for the year. In the fourth quarter of 2022 (Q4-22), we expect total revenue in the range of $50.5 million to $50.9 million, representing 26% YoY growth at the midpoint. For the fiscal year ending December 31, 2022, we expect total revenue in the range of $192.4 million to $192.8 million, representing 40% growth YoY at the midpoint of the range. As we plan for 2023, we expect a moderating growth trajectory, as our foreseeable sales pipeline indicates cycle extensions and softness compared to previous periods. Looking at our projected Non-GAAP operating loss for Q4-22, we expect it to be in the range of $(14.5) million to $(15.0) million and for the full year of 2022 between $(67.4) million and $(67.9) million. This outlook includes impacts to COGS and, in turn, to gross profit and gross margin from our Embee Mobile acquisition and the data.ai (formerly App Annie) partnership that were not present in the prior periods. As a reminder, we deployed data.ai data into our intelligence solutions as a new, revenue-generating module in Q2-22. Both Embee Mobile and data.ai expenses are fixed and increase COGS when compared to prior year periods. For modeling our business, we anticipate Non-GAAP gross margin to be approximately 75% to 76% in Q4-22, and approximately 75% for the year ending December 31, 2022 as a result of these impacts. Balancing Growth with Profitability As we enter the fourth quarter of 2022, we are taking action to strengthen our financial position as we pursue profitable growth and positive free cash flow during 2023. Prior to becoming a publicly traded company, we developed a culture of disciplined growth. We focused on optimizing our unit economics that enabled us to achieve positive free cash flow in the first quarter of 2021. We used the proceeds of our IPO to accelerate 10 Similarweb Q3 2022 Shareholder Letter
Exhibit 99.2 our growth with the same disciplined culture on a path that saw us achieve over 50% revenue growth year-over-year on a quarterly basis. Today, we are changing our strategic focus to balance growth and profitability, and to achieve positive free cash flow during 2023. We are focused on working smarter to drive operational efficiencies in order to accelerate our path to profitability. In the near term, we believe our business is resilient. Our SaaS solutions are designed to support the revenue-driving operations of our customers — sales, marketing, analytics, ecommerce — by providing tremendous visibility into risks and opportunities, which is especially valuable during times of uncertainty. We believe we have become a must-have technology solution that companies utilize to see and capture their growth opportunities in the digital world. Importantly, companies can utilize our easy-to-understand solutions on their own to make real-time course corrections and to optimize business performance based on our actionable insights in a cost-effective way. Over the long term, we are focused on achieving durable growth and sustained free cash flow. The important and difficult decisions we made to reorganize and prioritize we believe will enable us to adapt to the current environment and to overcome the challenges ahead. Addressing our customers’ growth challenges during these times of increasing uncertainty likely represents our most important opportunity to demonstrate our enduring value – we are focused on doing what we need to do to succeed. We look forward to keeping everyone updated on our progress. Sincerely, Or Offer Founder and Chief Executive Officer Jason Schwartz Chief Financial Officer 11 Similarweb Q3 2022 Shareholder Letter
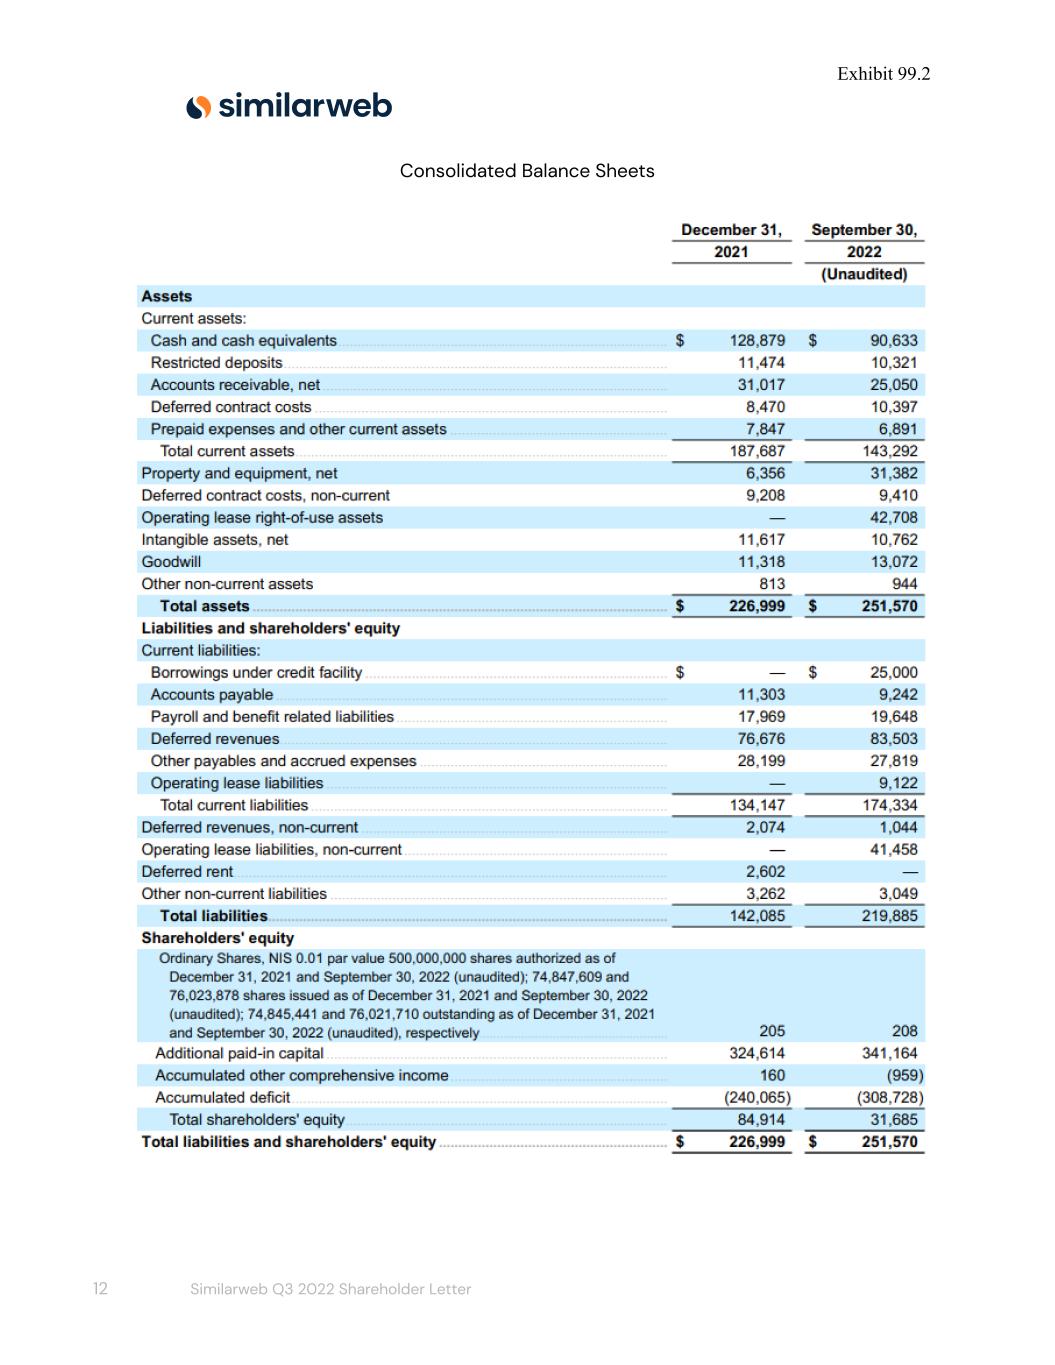
Exhibit 99.2 Consolidated Balance Sheets 12 Similarweb Q3 2022 Shareholder Letter
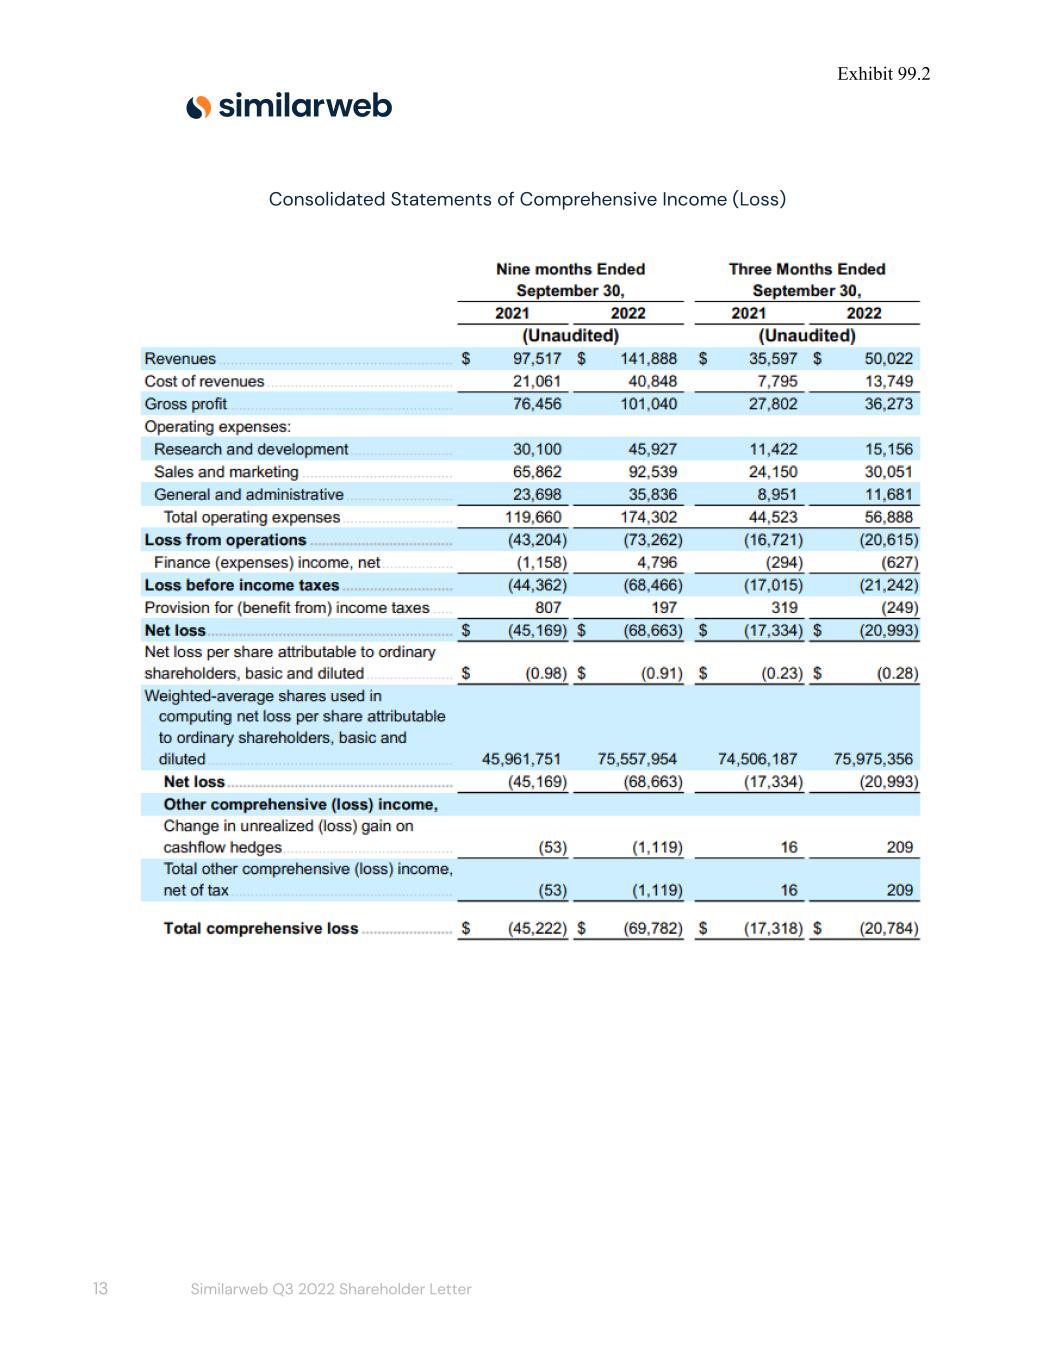
Exhibit 99.2 Consolidated Statements of Comprehensive Income (Loss) 13 Similarweb Q3 2022 Shareholder Letter
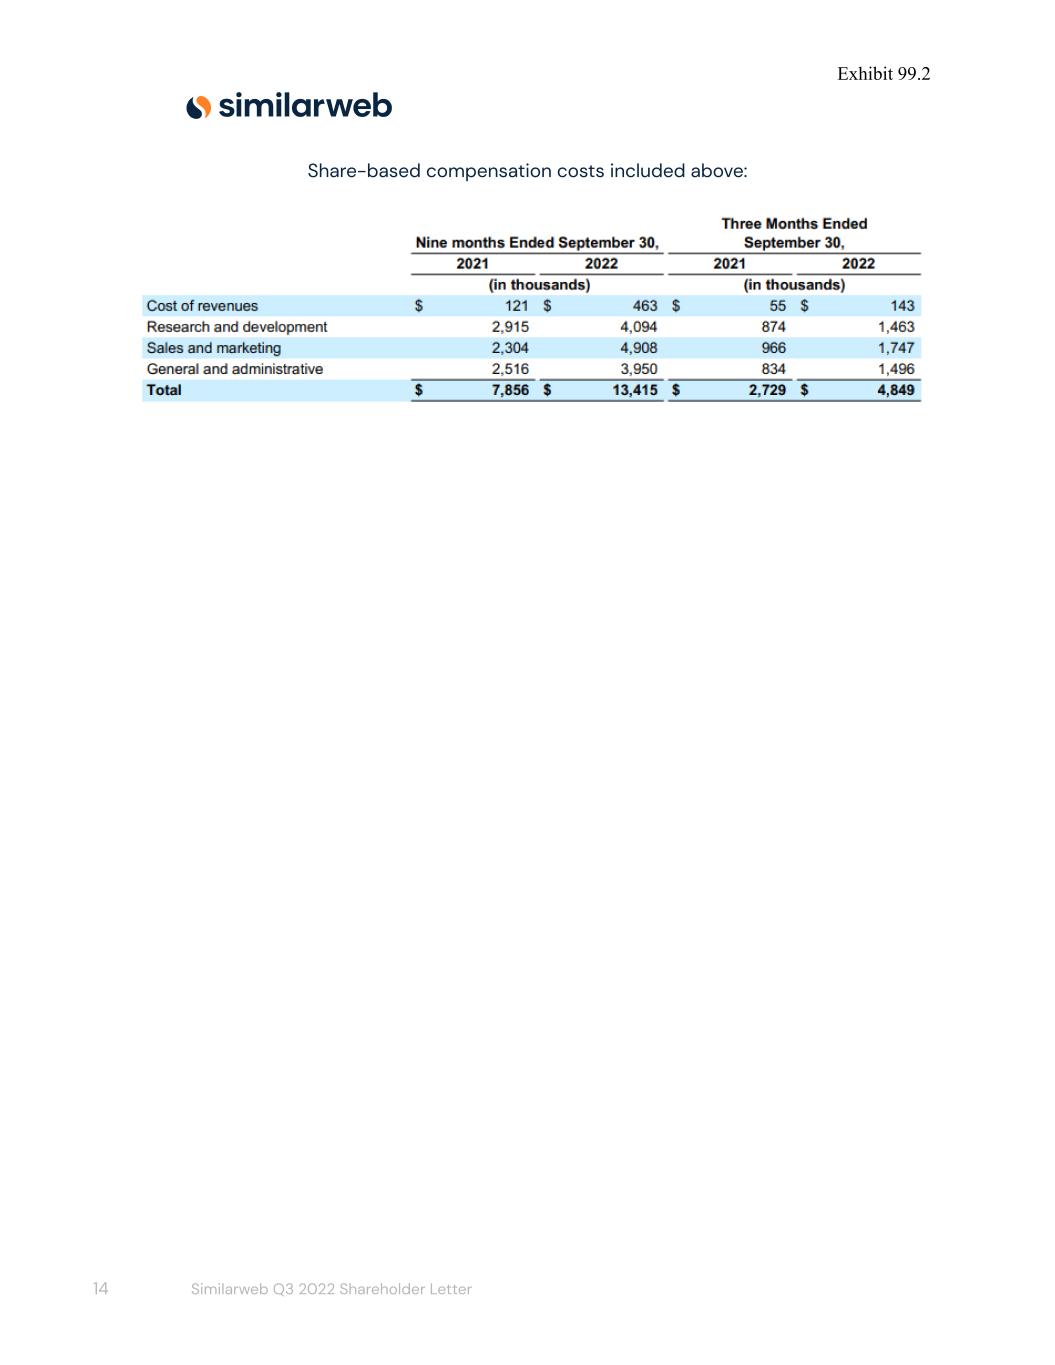
Exhibit 99.2 Share-based compensation costs included above: 14 Similarweb Q3 2022 Shareholder Letter
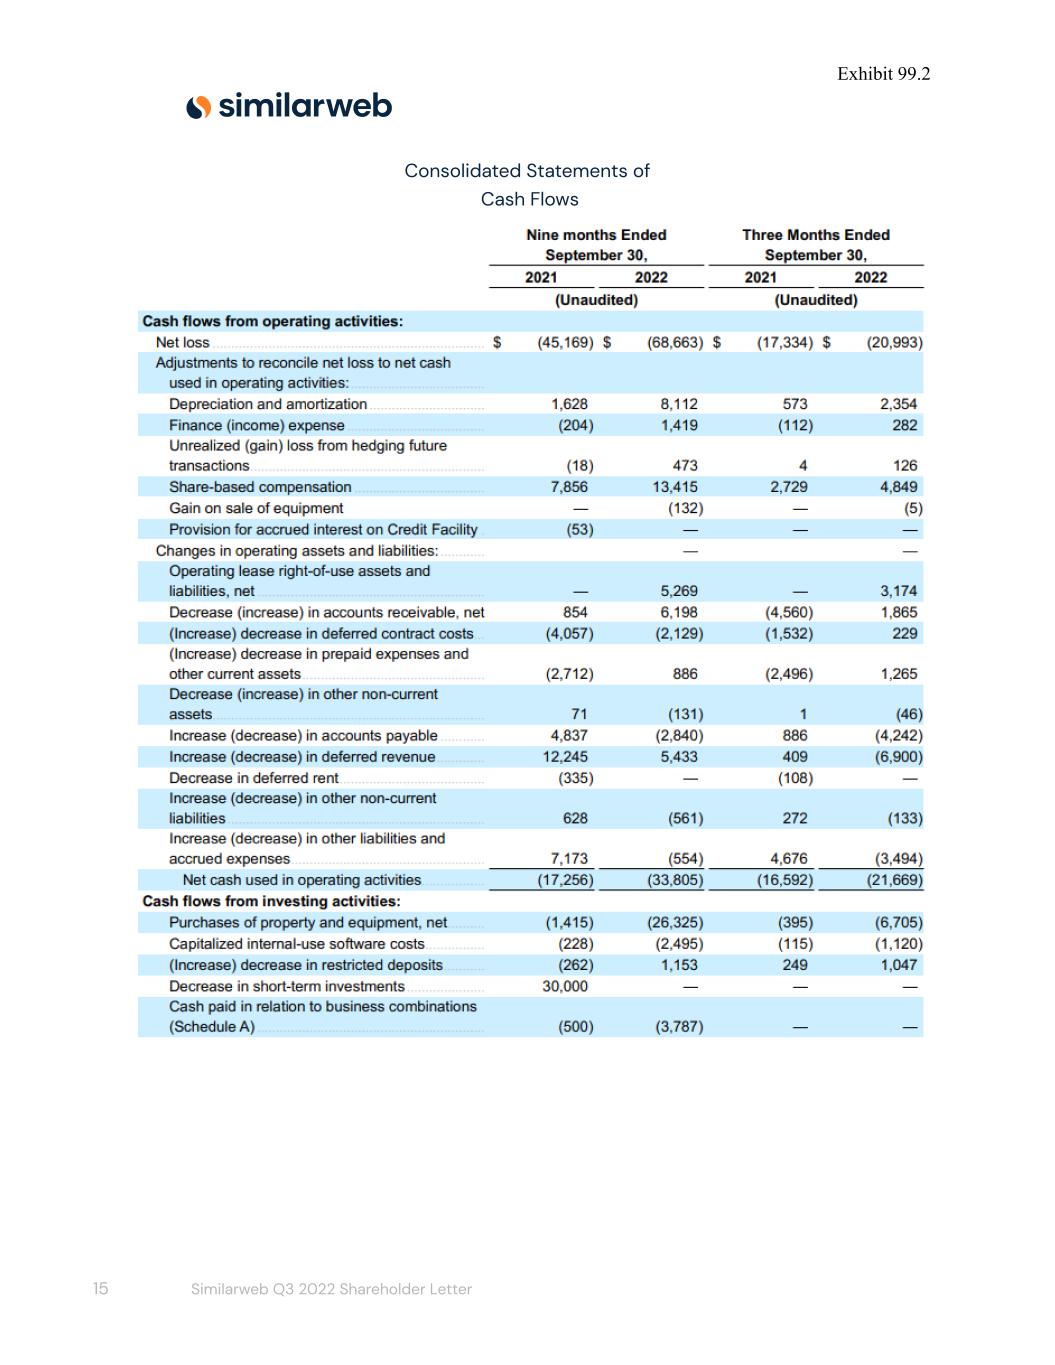
Exhibit 99.2 Consolidated Statements of Cash Flows 15 Similarweb Q3 2022 Shareholder Letter
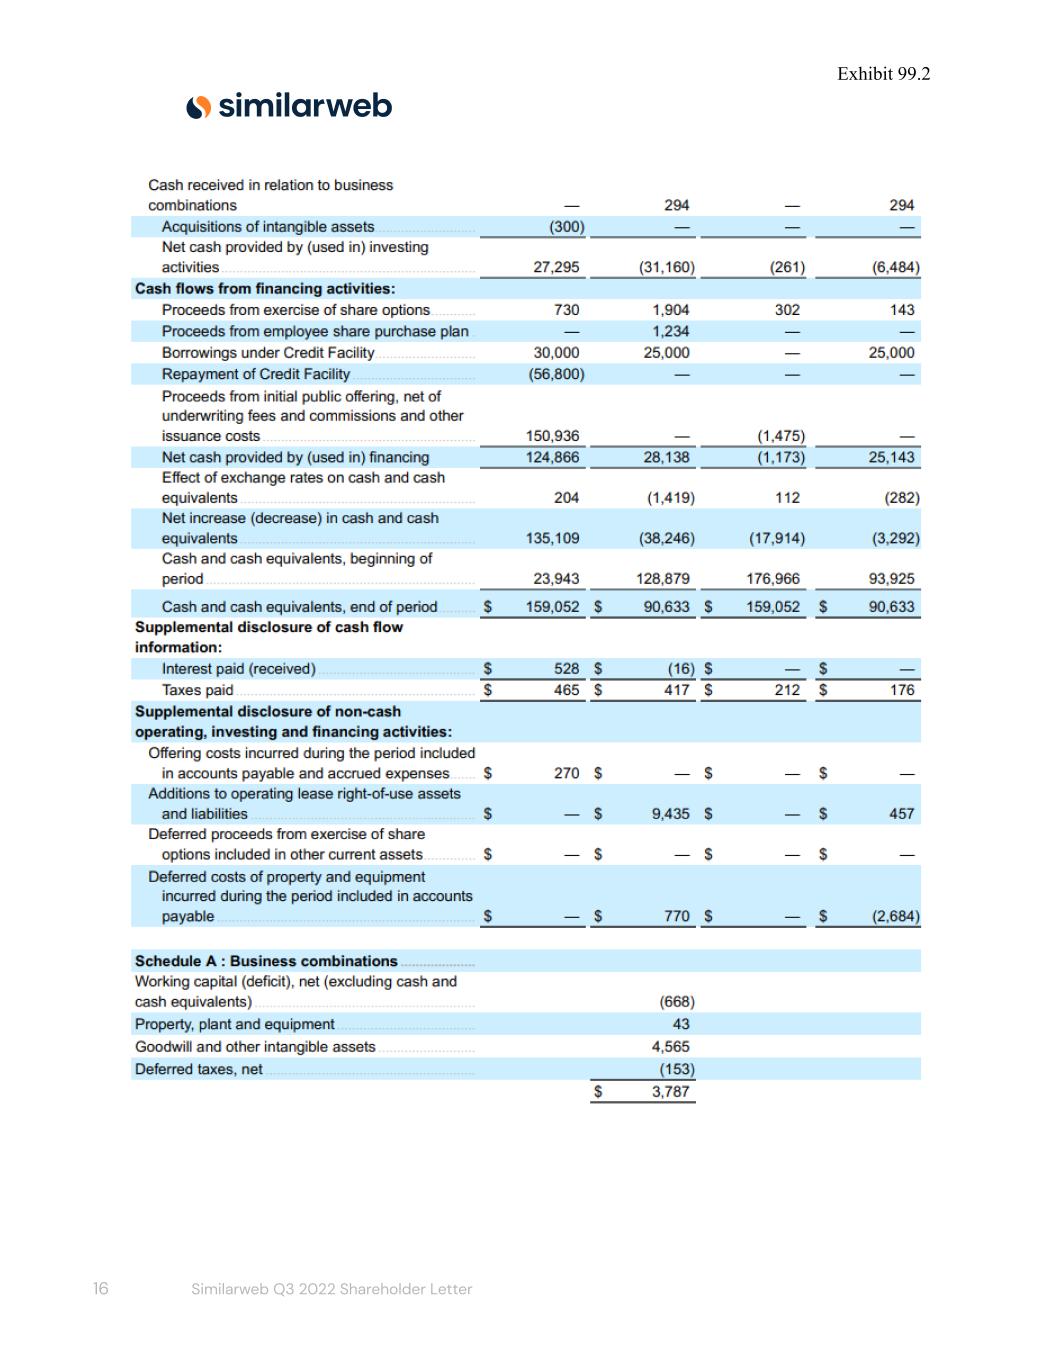
Exhibit 99.2 16 Similarweb Q3 2022 Shareholder Letter
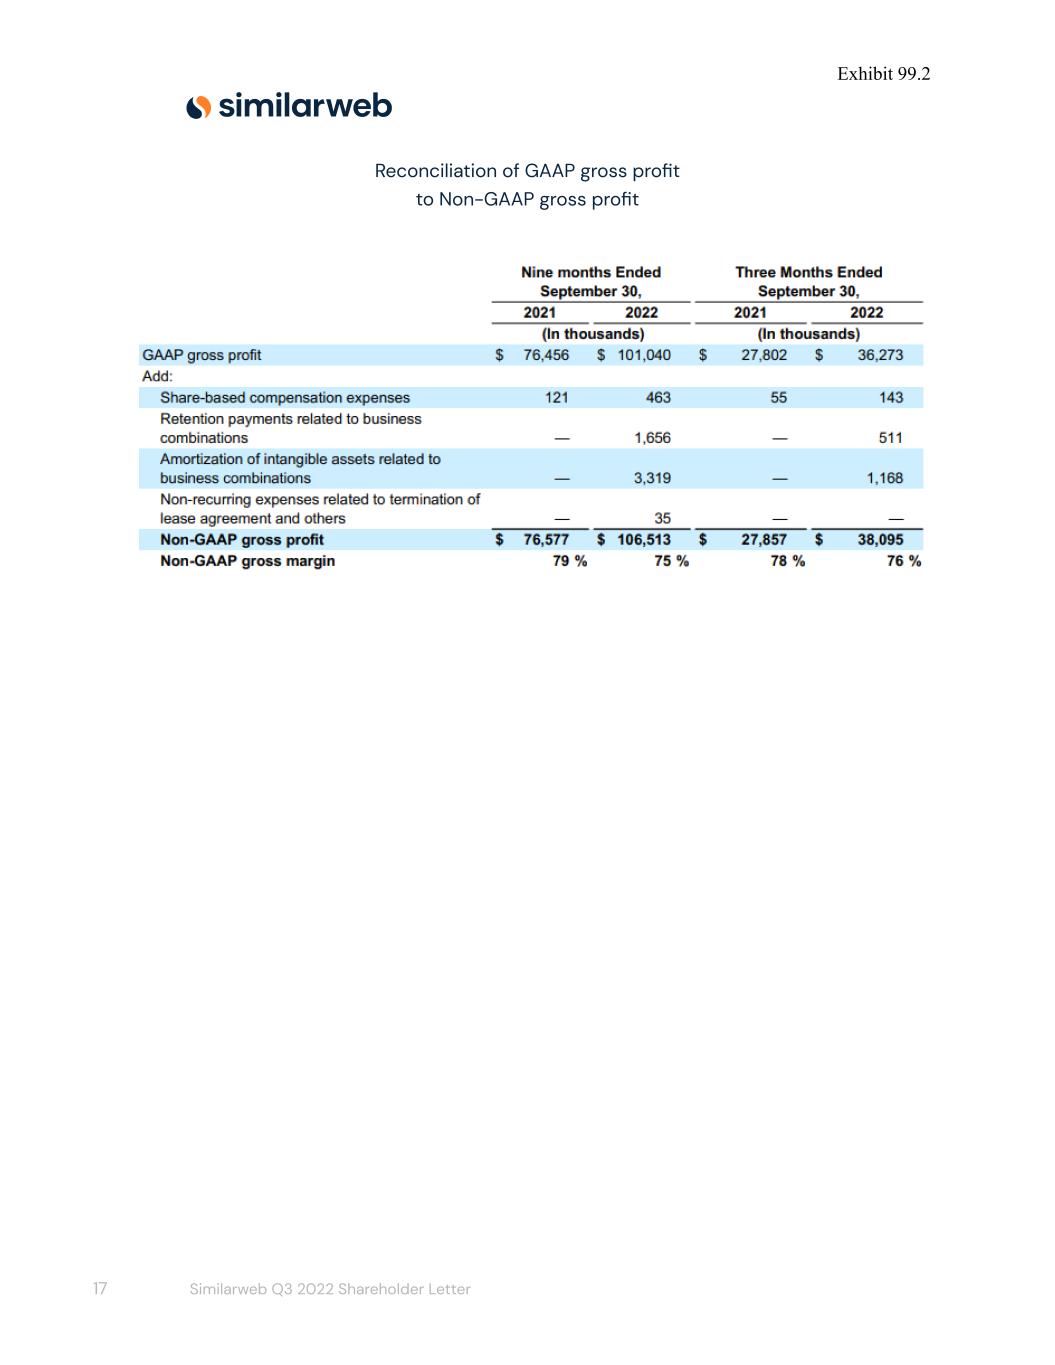
Exhibit 99.2 Reconciliation of GAAP gross profit to Non-GAAP gross profit 17 Similarweb Q3 2022 Shareholder Letter
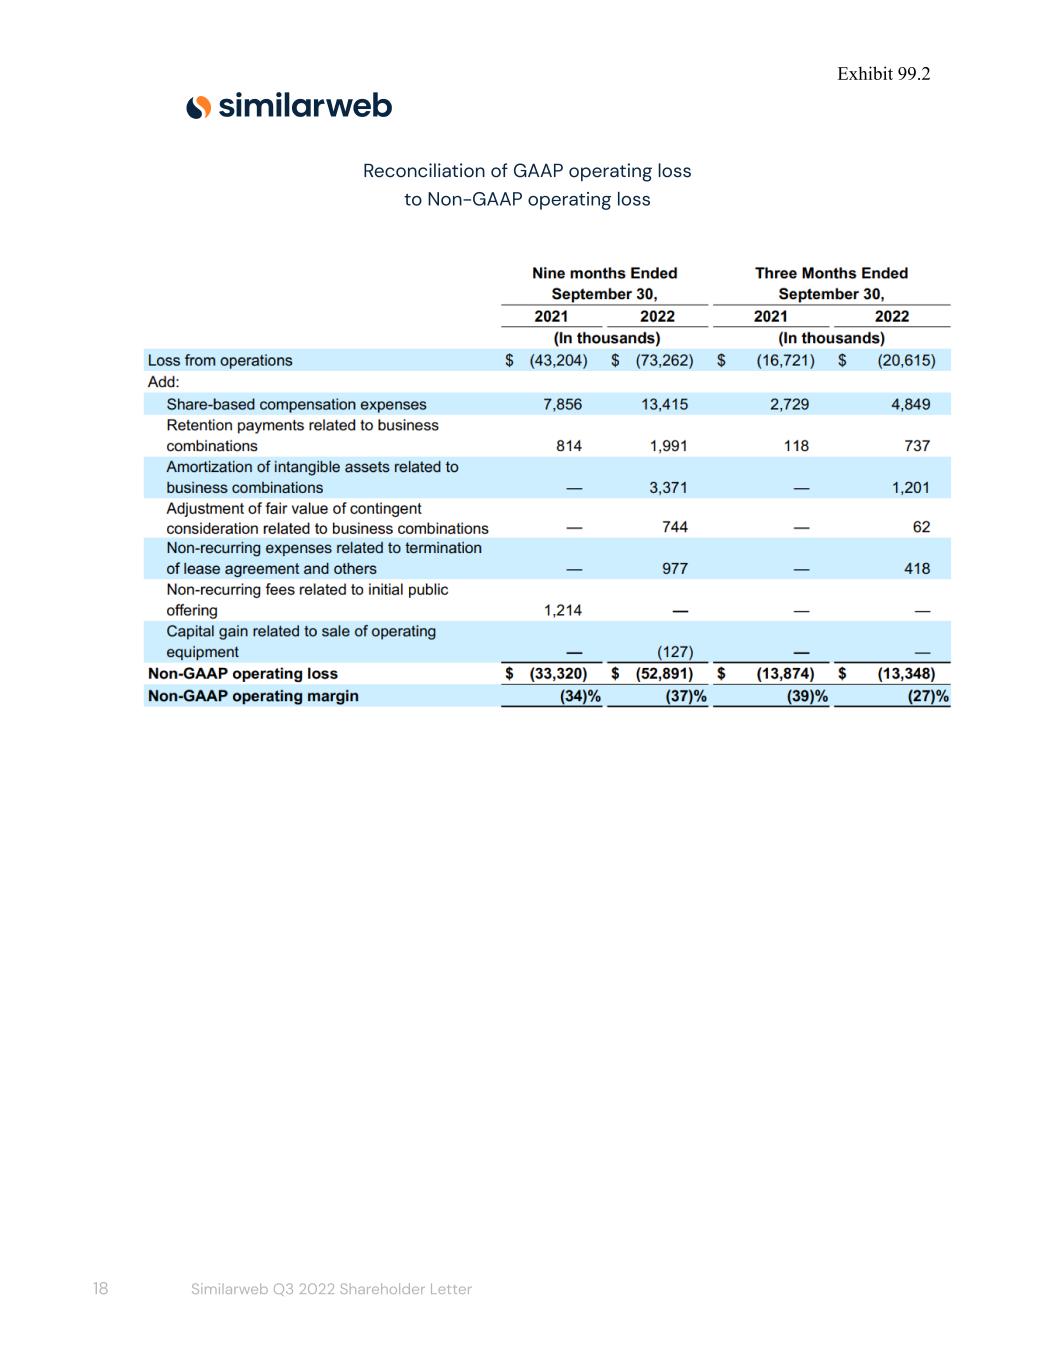
Exhibit 99.2 Reconciliation of GAAP operating loss to Non-GAAP operating loss 18 Similarweb Q3 2022 Shareholder Letter
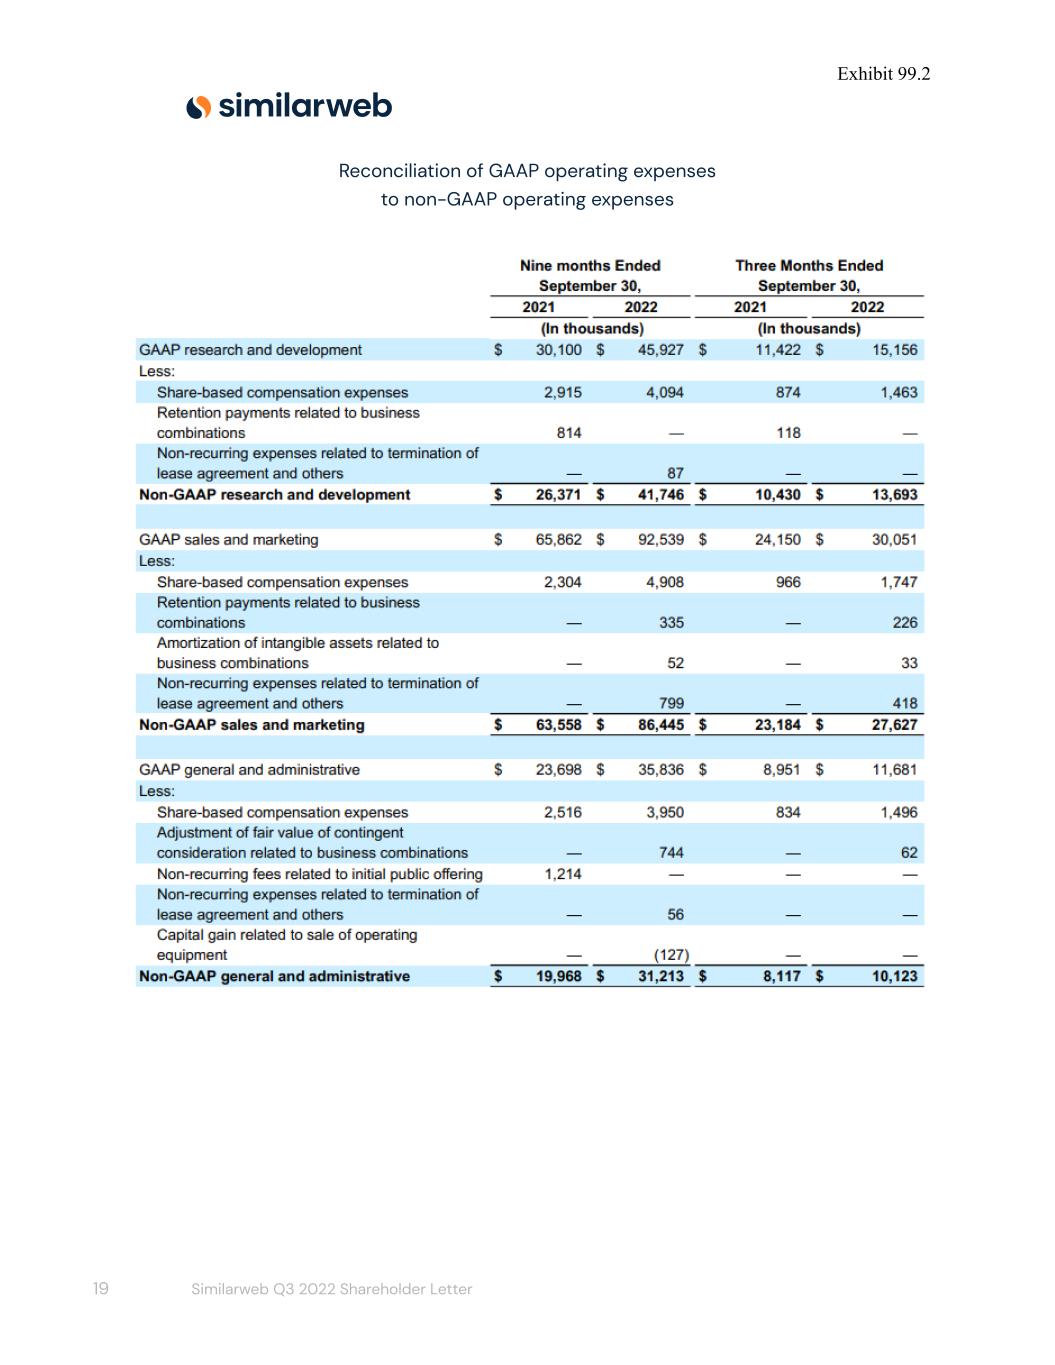
Exhibit 99.2 Reconciliation of GAAP operating expenses to non-GAAP operating expenses 19 Similarweb Q3 2022 Shareholder Letter
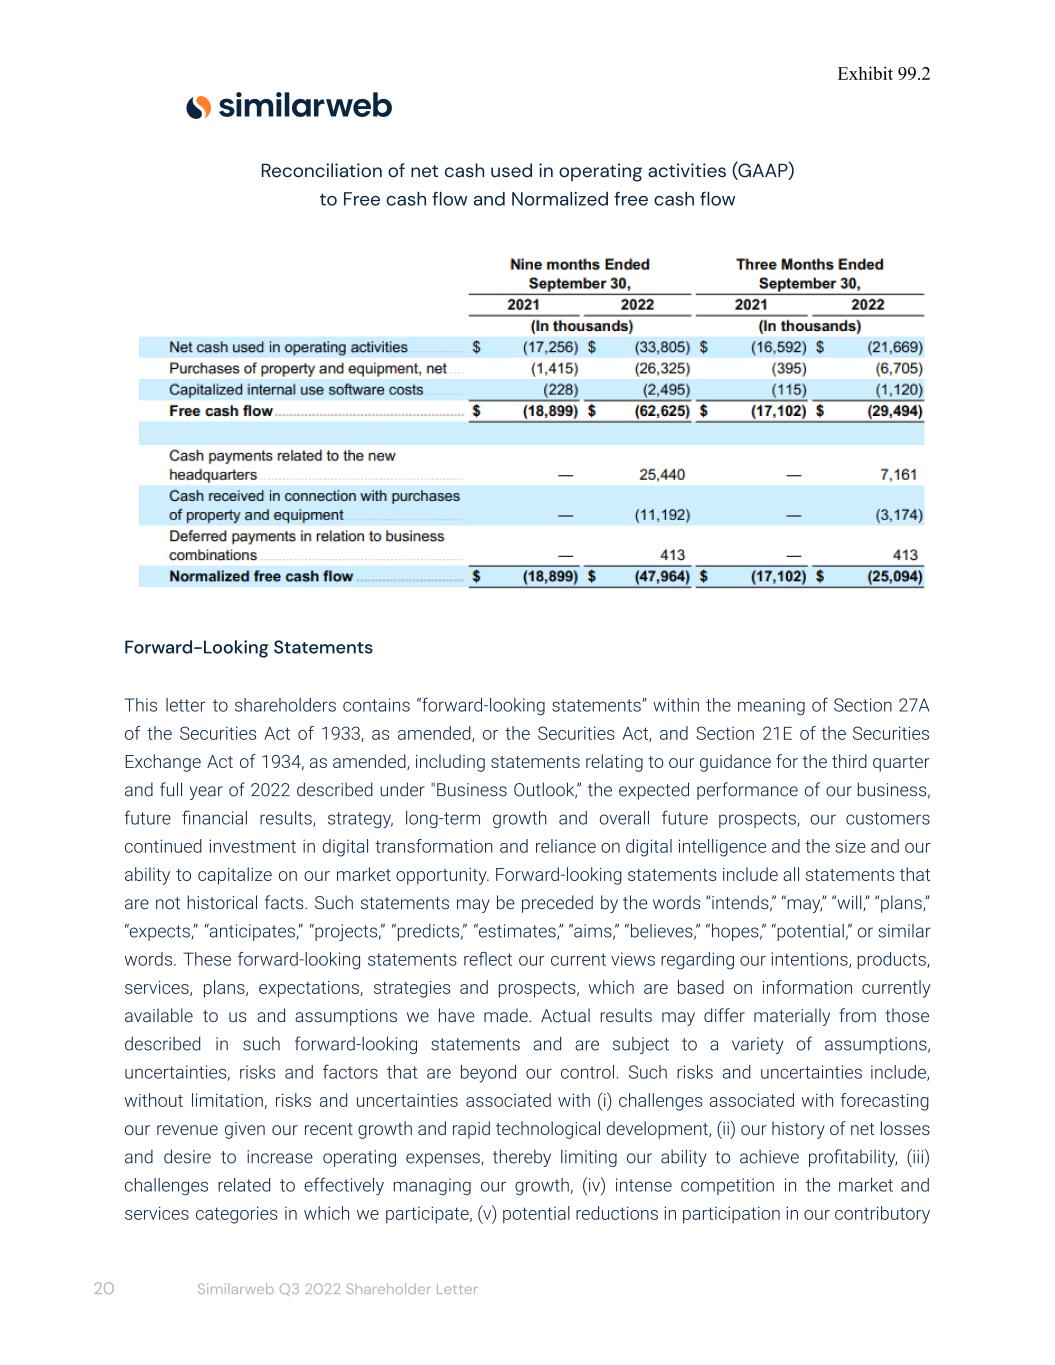
Exhibit 99.2 Reconciliation of net cash used in operating activities (GAAP) to Free cash flow and Normalized free cash flow Forward-Looking Statements This letter to shareholders contains “forward-looking statements” within the meaning of Section 27A of the Securities Act of 1933, as amended, or the Securities Act, and Section 21E of the Securities Exchange Act of 1934, as amended, including statements relating to our guidance for the third quarter and full year of 2022 described under "Business Outlook,” the expected performance of our business, future financial results, strategy, long-term growth and overall future prospects, our customers continued investment in digital transformation and reliance on digital intelligence and the size and our ability to capitalize on our market opportunity. Forward-looking statements include all statements that are not historical facts. Such statements may be preceded by the words “intends,” “may,” “will,” “plans,” “expects,” “anticipates,” “projects,” “predicts,” “estimates,” “aims,” “believes,” “hopes,” “potential,” or similar words. These forward-looking statements reflect our current views regarding our intentions, products, services, plans, expectations, strategies and prospects, which are based on information currently available to us and assumptions we have made. Actual results may differ materially from those described in such forward-looking statements and are subject to a variety of assumptions, uncertainties, risks and factors that are beyond our control. Such risks and uncertainties include, without limitation, risks and uncertainties associated with (i) challenges associated with forecasting our revenue given our recent growth and rapid technological development, (ii) our history of net losses and desire to increase operating expenses, thereby limiting our ability to achieve profitability, (iii) challenges related to effectively managing our growth, (iv) intense competition in the market and services categories in which we participate, (v) potential reductions in participation in our contributory 20 Similarweb Q3 2022 Shareholder Letter
Exhibit 99.2 network and/or increase in the volume of opt-out requests from individuals with respect to our collection of their data, or a decrease in our direct measurement dataset, which could lead to a deterioration in the depth, breadth or accuracy of our data, (vi) our inability to attract new customers and expand subscriptions of current customers, (vii) changes in laws, regulations, and public perception concerning data privacy or change in the patterns of enforcement of existing laws and regulations, (viii) our inability to introduce new features or solutions and make enhancements to our existing solutions, (ix) real or perceived errors, failures, vulnerabilities or bugs in our platform, (x) potential security breaches to our systems or to the systems of our third-party service providers, (xi) our inability to obtain and maintain comprehensive and reliable data to generate our insights, (xii) changes in laws and regulations related to the Internet or changes in the Internet infrastructure itself that may diminish the demand for our solutions, (xiii) failure to effectively develop and expand our direct sales capabilities, which could harm our ability to increase the number of organizations using our platform and achieve broader market acceptance for our solutions, and (xiv) the impact that current worldwide geopolitical and macroeconomic uncertainty, including uncertainty resulting from the COVID-19 pandemic or other public health crises and the Russian military operations in Ukraine, and any related economic downturn could have on our or our customers' businesses, financial condition and results of operations. These risks and uncertainties are more fully described in our filings with the Securities and Exchange Commission, including in the section entitled “Risk Factors” in our Form 20-F filed with the Securities and Exchange Commission on March 25, 2022, and subsequent reports that we file with the Securities and Exchange Commission. Moreover, we operate in a very competitive and rapidly changing environment. New risks emerge from time to time. It is not possible for our management to predict all risks, nor can we assess the impact of all factors on our business or the extent to which any factor, or combination of factors, may cause actual results to differ materially from those contained in any forward-looking statements we may make. In light of these risks, uncertainties, and assumptions, we cannot guarantee future results, levels of activity, performance, achievements, or events and circumstances reflected in the forward-looking statements will occur. Forward-looking statements represent our beliefs and assumptions only as of the date of this letter. Except as required by law, we undertake no duty to update any forward-looking statements contained in this release as a result of new information, future events, changes in expectations, or otherwise. Certain information contained in this letter relates to or is based on studies, publications, surveys, and other data obtained from third-party sources and the Company's own internal estimates and research. While the Company believes these third-party sources to be reliable as of the date of this letter, it has not independently verified, and makes no representation as to the adequacy, fairness, accuracy, or completeness of any information obtained from third-party sources. In addition, all of the market data included in this letter involves a number of assumptions and limitations, and there can be no 21 Similarweb Q3 2022 Shareholder Letter
Exhibit 99.2 guarantee as to the accuracy or reliability of such assumptions. Finally, while we believe our own internal research is reliable, such research has not been verified by any independent source. Non-GAAP Financial Measures This letter to shareholders contains certain financial measures that are expressed on a non-GAAP basis. We use these non-GAAP financial measures internally to facilitate analysis of our financial and business trends and for internal planning and forecasting purposes. We believe these non-GAAP financial measures, when taken collectively, may be helpful to investors because they provide consistency and comparability with past financial performance by excluding certain items that may not be indicative of our business, results of operations, or outlook. However, non-GAAP financial measures have limitations as an analytical tool and are presented for supplemental informational purposes only. They should not be considered in isolation from, or as a substitute for, financial information prepared in accordance with GAAP. Free cash flow represents net cash provided by (used in) operating activities less capital expenditures and capitalized internal-use software costs. Normalized free cash flow represents free cash flow less capital investments related to the Company's new headquarters, payments received in connection with these capital investments and deferred payments related to business combinations. Non-GAAP operating income (loss), non-GAAP gross profit, Non-GAAP research and development expenses, non-GAAP sales and marketing expenses, and non-GAAP general and administrative expenses represents the comparable GAAP financial figure, less share-based compensation, adjustments, and payments related to business combinations, amortization of intangible assets, and certain other non-recurring items, as applicable and indicated in the above tables. Other Metrics Customer acquisition costs (CAC) represent the portion of sales and marketing expenses allocated to acquire new customers. Customer retention costs (CRC) represent the portion of sales and marketing expenses allocated to retain existing customers and to increase existing customers’ subscriptions. Annual recurring revenue (ARR) represents the annualized subscription revenue we would contractually expect to receive from customers assuming no increases or reductions in their subscriptions. CAC payback period is the estimated time in months to recover CAC in terms of incremental gross profit that newly acquired customers generate. Net retention rate (NRR) represents the comparison of our ARR from the same set of customers as of a certain point in time, relative to the same point in time in the previous year ago period, expressed as a percentage. 22 Similarweb Q3 2022 Shareholder Letter