EX-99.2
Published on August 6, 2024
Exhibit 99.2 Dear Shareholders, Three years after our IPO, we are proud that Similarweb is a growing, profitable and cash generating company. In the second quarter of 2024 (Q2-24), revenue growth continued to accelerate and we delivered another record non-GAAP operating margin, representing a fourth consecutive quarter of operating profit. Our base of annual recurring revenue customers continued to grow and now exceeds 5,000 customers, including our first 8-digit ARR customer. We generated positive free cash flow for the third consecutive quarter and generated $16 million of free cash flow in the first half of 2024. And while Q2-24 was indeed a successful quarter, we believe that we are still only starting to realize the significant potential of our data and the markets that we serve. Our Unique Digital Data At our core, we are a data company. Our unique data asset, Similarweb Digital Data, provides the foundation for our solutions and consists of our proprietary estimations of the performance of companies, markets, products, consumer behavior and trends in the digital world. Our world-class team of nearly 300 data scientists, engineers, developers and analysts gathers billions of unrefined data points amounting to close to one percent of online transactions and interactions, and then transforms them into a comprehensive view of the internet across the web, mobile web and apps. We deliver Similarweb Digital Data to our customers via Software-as-a-Service (SaaS) solutions, Data-as-a-Service (DaaS), and recurring Advisory Services. Our customers rely on our mission-critical offerings to power data-driven growth decisions that they make in their businesses, to devise strategy, acquire customers, and increase monetization. We invest continuously in our technology and analytics to expand and enhance our data and deliver the most comprehensive and valuable understanding of the ever-changing digital landscape to empower our customers with the knowledge and tools to compete successfully in a rapidly evolving digital world. In July, we acquired 42matters AG, a Swiss app intelligence provider, to expand our data capabilities in the rapidly growing app analytics market. As of today’s date, 42matters’ app data covers 12 app store platforms, over 2.1 million publishers, 2,600+ SDKs, and more than 20 million apps. By combining 42matters and Similarweb, we have expanded our app intelligence offering across app store data, app engagement data, and mobile SDK data and can now provide enhanced insights for app owners into the performance of their own 1 Similarweb Q2 2024 Shareholder Letter
Exhibit 99.2 apps versus those of their competitors, as well as more comprehensive visibility of user engagement and technology stacks. We expect that this will empower app owners to optimize their app distribution, marketing strategies and development roadmaps. We would like to welcome the 42matters team to Similarweb and look forward to working together to build a market leading app intelligence offering. Our commitment to delivering the most comprehensive and valuable insights into the digital world drives us to continually enhance our data. Last week, we released our newest data version. This new version significantly enhances the accuracy of our data sets by providing broader insights from more than 30 million new websites across many more countries compared to the previous data version. We have also updated our proprietary algorithms and now factor in our advanced web methodologies as well as industry changes. These enhancements follow the investments we are making in research and development to continuously improve the quality of our data. We believe that the new data version provides a more accurate and more complete representation of the digital world. We are excited with these new data sets and the impact we believe they will have in improved benchmarking and decision-making. We have already begun to receive positive feedback from customers around the world who share in our excitement. Our Business Performance Total revenue for Q2-24 was $60.6 million, an increase of 13% compared to $53.7 million for the second quarter of 2023 (Q2-23), exceeding the top end of our estimate range.The 13% revenue growth in the quarter follows 12% and 11% YoY growth in Q1-24 and Q4-23 respectively - a third consecutive quarter of accelerating revenue growth. 2 Similarweb Q2 2024 Shareholder Letter
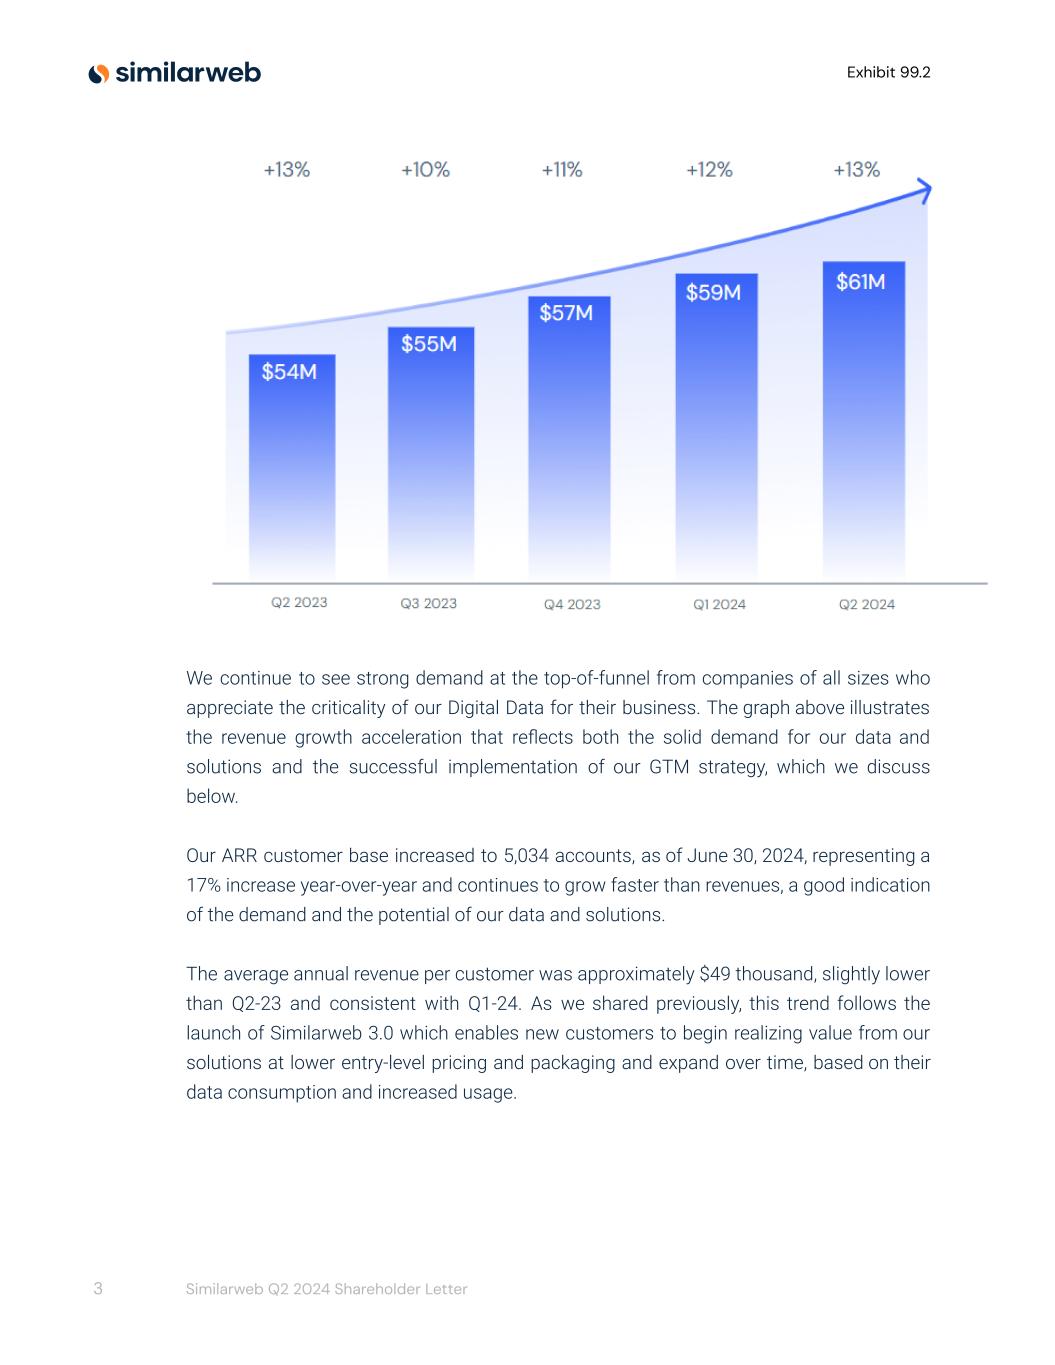
Exhibit 99.2 We continue to see strong demand at the top-of-funnel from companies of all sizes who appreciate the criticality of our Digital Data for their business. The graph above illustrates the revenue growth acceleration that reflects both the solid demand for our data and solutions and the successful implementation of our GTM strategy, which we discuss below. Our ARR customer base increased to 5,034 accounts, as of June 30, 2024, representing a 17% increase year-over-year and continues to grow faster than revenues, a good indication of the demand and the potential of our data and solutions. The average annual revenue per customer was approximately $49 thousand, slightly lower than Q2-23 and consistent with Q1-24. As we shared previously, this trend follows the launch of Similarweb 3.0 which enables new customers to begin realizing value from our solutions at lower entry-level pricing and packaging and expand over time, based on their data consumption and increased usage. 3 Similarweb Q2 2024 Shareholder Letter
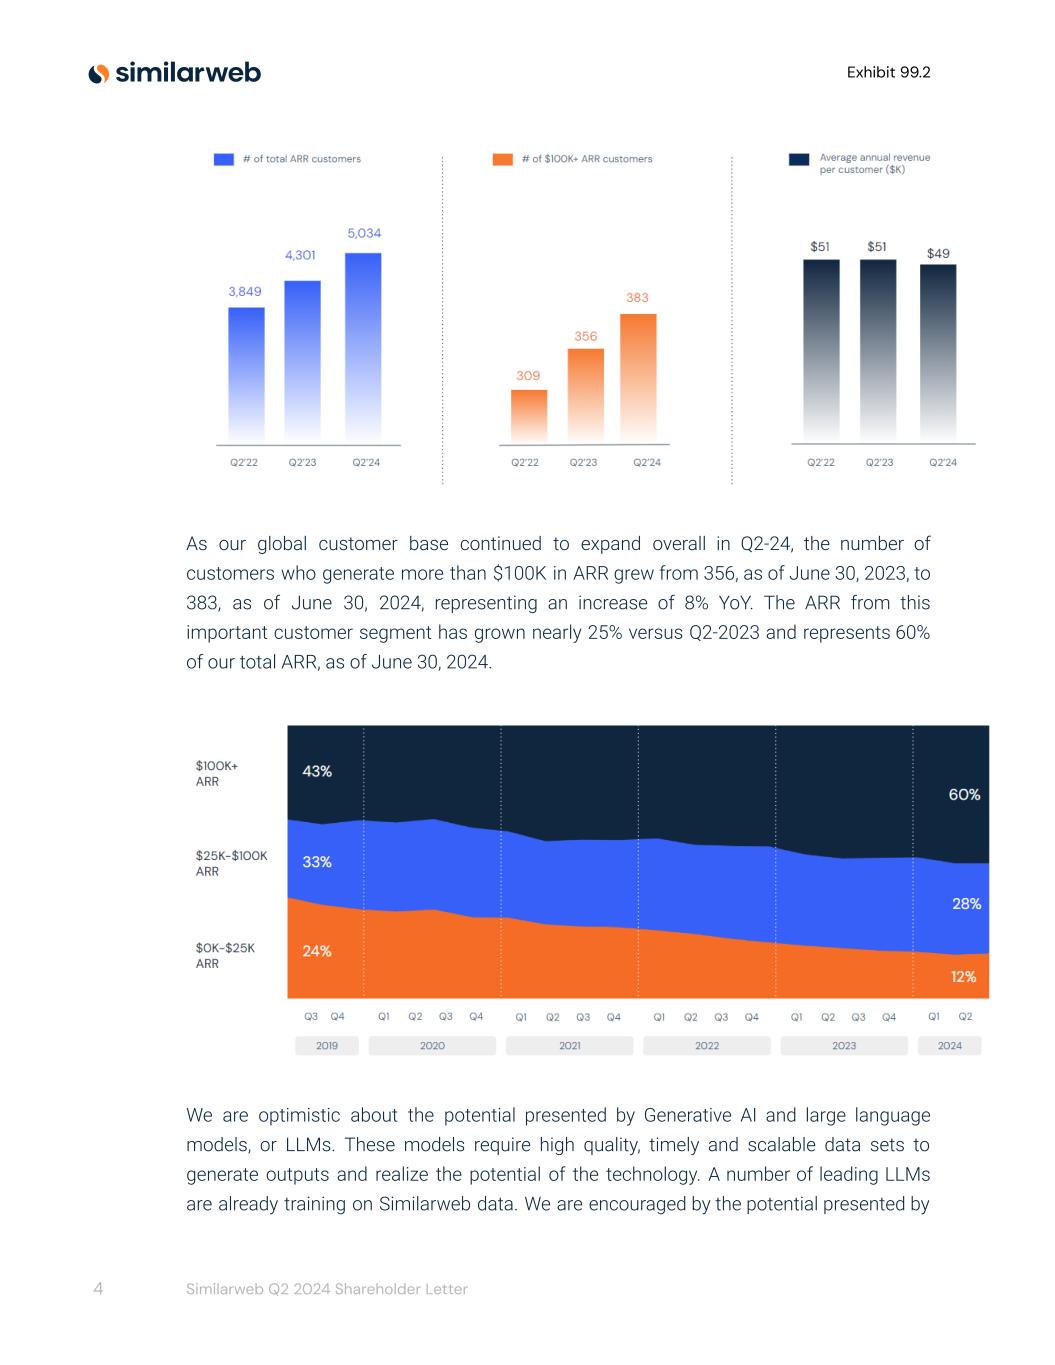
Exhibit 99.2 As our global customer base continued to expand overall in Q2-24, the number of customers who generate more than $100K in ARR grew from 356, as of June 30, 2023, to 383, as of June 30, 2024, representing an increase of 8% YoY. The ARR from this important customer segment has grown nearly 25% versus Q2-2023 and represents 60% of our total ARR, as of June 30, 2024. We are optimistic about the potential presented by Generative AI and large language models, or LLMs. These models require high quality, timely and scalable data sets to generate outputs and realize the potential of the technology. A number of leading LLMs are already training on Similarweb data. We are encouraged by the potential presented by 4 Similarweb Q2 2024 Shareholder Letter
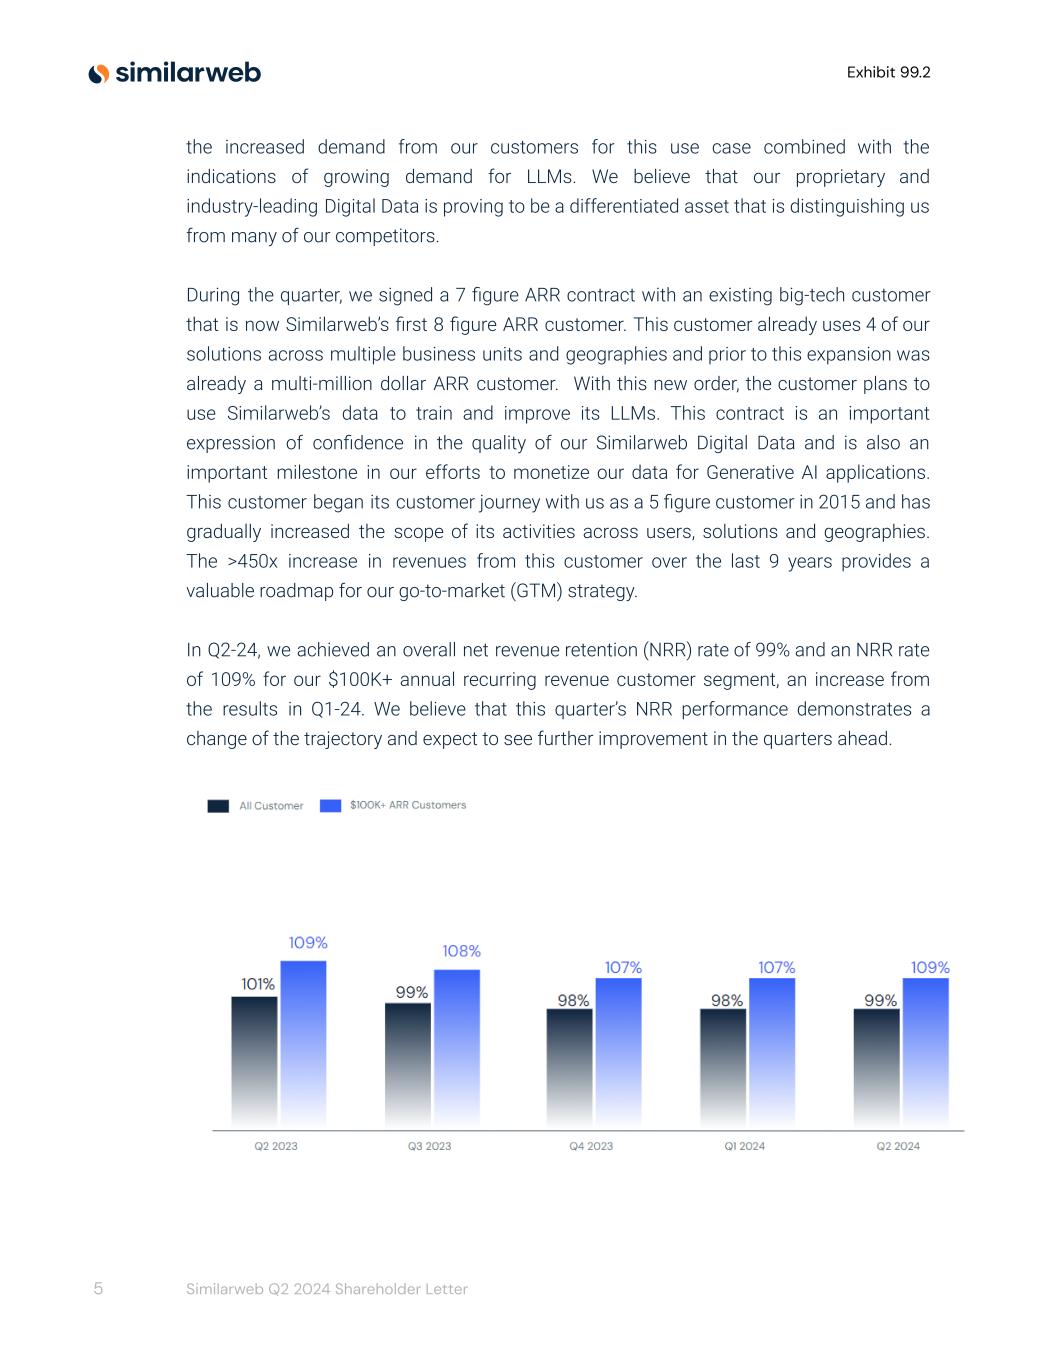
Exhibit 99.2 the increased demand from our customers for this use case combined with the indications of growing demand for LLMs. We believe that our proprietary and industry-leading Digital Data is proving to be a differentiated asset that is distinguishing us from many of our competitors. During the quarter, we signed a 7 figure ARR contract with an existing big-tech customer that is now Similarweb’s first 8 figure ARR customer. This customer already uses 4 of our solutions across multiple business units and geographies and prior to this expansion was already a multi-million dollar ARR customer. With this new order, the customer plans to use Similarweb’s data to train and improve its LLMs. This contract is an important expression of confidence in the quality of our Similarweb Digital Data and is also an important milestone in our efforts to monetize our data for Generative AI applications. This customer began its customer journey with us as a 5 figure customer in 2015 and has gradually increased the scope of its activities across users, solutions and geographies. The >450x increase in revenues from this customer over the last 9 years provides a valuable roadmap for our go-to-market (GTM) strategy. In Q2-24, we achieved an overall net revenue retention (NRR) rate of 99% and an NRR rate of 109% for our $100K+ annual recurring revenue customer segment, an increase from the results in Q1-24. We believe that this quarter’s NRR performance demonstrates a change of the trajectory and expect to see further improvement in the quarters ahead. 5 Similarweb Q2 2024 Shareholder Letter
Exhibit 99.2 Our GTM strategy is focused on two key motions that we often refer to as a “barbell strategy”. On one end of the barbell, we continue to sign up new customers at an entry price point that is typically lower than our average revenue per customer. Our GTM team can flexibly package these to match the customers’ requirements and budgets. Some customers, particularly SMBs, that we define as companies with less than 1,000 employees, opt to sign up for our skinnier self-service package that is priced competitively and does not entail significant onboarding and training costs. After more than a decade of experience, we have learned that once a customer has subscribed to our data or products and utilizes them regularly, they tend to develop expertise in deriving significant value from our data generating a positive return on their investment. This typically drives increased utilization as our customers seek to expand their access to our data to extract insights from additional geographies and data sets, increasing the share of their wallet they allocate to Similarweb. One of the key metrics we keep a close eye on is customer utilization of the platform, as this metric is often the most relevant leading indicator of the potential for retention and expansion or alternatively the risk of churn. At the other end of the barbell are the large enterprise customers. These customers typically generate ARR for us in the six to seven figure range. Like the eight figure customer discussed above, many of these customers began their journey as four or five figure ARR customers and have expanded over time. Our customer success team members are focused on ensuring that our new and existing customers have all the tools and resources to extract the significant value our Digital Data provides. To support our enterprise customers, we recently launched a series of dedicated portals for many of our customers. Each of these portals include a range of training resources to ensure the users can maximize the commercial opportunities that our data and solutions provide. Our Financial Results When examining our financial results, please note that references to expenses and operating results (other than revenue) are presented both on a GAAP and on a non-GAAP basis below, and that all non-GAAP results are reconciled to the most directly comparable GAAP results in the financial statements exhibits presented at the end of this letter. 6 Similarweb Q2 2024 Shareholder Letter
Exhibit 99.2 Revisiting our top line results, in Q2-24 we delivered revenue of $60.6 million, reflecting 13% growth as compared to Q2-23, driven primarily by an increase in the number of customers. The vast majority of our revenue is annual recurring revenue with minimum subscription terms of one year. We continue to increase the number of customers with multi-year subscription terms. As of the end of Q2-24, 44% of our ARR was generated from customers with multi-year subscription commitments, compared to 42% at the same time last year. We continue to believe this is a strong indicator of the long-term durability of our customer relationships and demand for our solutions. Our GAAP gross profit totaled $48.1 million and our non-GAAP gross profit totaled $49.5 million in Q2-24, compared to $41.1 million and $42.7 million in Q2-23, respectively. Non-GAAP gross margin expanded to 82% in Q2-24, versus 79% in Q2-23. Our GAAP operating expenses decreased to $49.0 million and our non-GAAP operating expenses decreased to $44.2 million in Q2-24, down from $50.9 million and $46.1 million in Q2-23, respectively, largely reflecting our focus on operating efficiency. Non-GAAP operating expenses represented 73% of revenue in Q2-24 as compared to 86% of revenue in Q2-23. Specific components of our second quarter 2024 operating expenses: Our GAAP research and development investment decreased to $12.2 million and our non-GAAP research and development investment decreased to $10.9 million in Q2-24, down from $13.9 million and $12.4 million in Q2-23, respectively. As a percentage of revenue, non-GAAP research & development expense was 18% in Q2-24, as compared to 23% in Q2-23. We expect non-GAAP research & development expenses to increase as we continue to invest in our data moat and innovation. GAAP sales and marketing expenses decreased to $25.9 million and non-GAAP sales and marketing expenses decreased to $24.4 million in Q2-24, down from $26.4 million and $24.8 million in Q2-23, respectively, driven primarily by our ongoing efforts to align our resources with our growth trajectory. As a percentage of revenue, non-GAAP sales & marketing expense was 40% in Q2-24, as compared to 46% in Q2-23. 7 Similarweb Q2 2024 Shareholder Letter
Exhibit 99.2 An operating tenet in our model is that our sales and marketing costs are divided with approximately 50% to 55% attributable to new customer acquisition (land), and the remaining 45% to 50% attributable to retention, upselling and cross-selling (expand) of our existing customer base. When analyzing our investment in customer acquisition costs (CAC) for growth efficiency, we track an estimated payback period. This metric has historically averaged between 15 and 16 months on a gross profit basis over the trailing four quarters. As of Q2-24, the average payback is ranging between 20 and 21 months, primarily due to longer sales cycles over the last year. Payback from expansion and customer retention costs (CRC) is faster than payback on new customer CAC such that we are generating a 55%-60% contribution margin on our recurring customer base which contributes meaningfully to our growth efficiency. We intend to continue to invest in customer acquisition to support future growth, as well as in customer retention to drive NRR and to increase the lifetime value of our customers. GAAP general and administrative costs increased to $11.0 million from $10.5 million in Q2-23, and our non-GAAP general and administrative costs slightly increased to $8.9 million in Q2-24 from $8.8 million in Q2-23. As a percentage of revenue, non-GAAP general & administrative expense was 15% in Q2-24, an improvement of 1 percentage point compared to Q2-23. Looking at our bottom line, the Q2-24 GAAP operating loss was ($1.0) million or (2%) of revenue, compared to ($9.8) million or (18%) of revenue for the second quarter of 2023. Q2-24 non-GAAP operating profit was $5.3 million or 9% of revenue, compared to a non-GAAP operating loss of ($3.5) million or (6%) of revenue for the second quarter of 2023, and exceeded our forecast. This is our fourth consecutive profitable quarter on a non-GAAP basis. Our dedication to achieving profitable growth over the last year yielded significant operating efficiencies across the business, which drove an operating margin improvement of 15 percentage points year over year in Q2-24. 8 Similarweb Q2 2024 Shareholder Letter
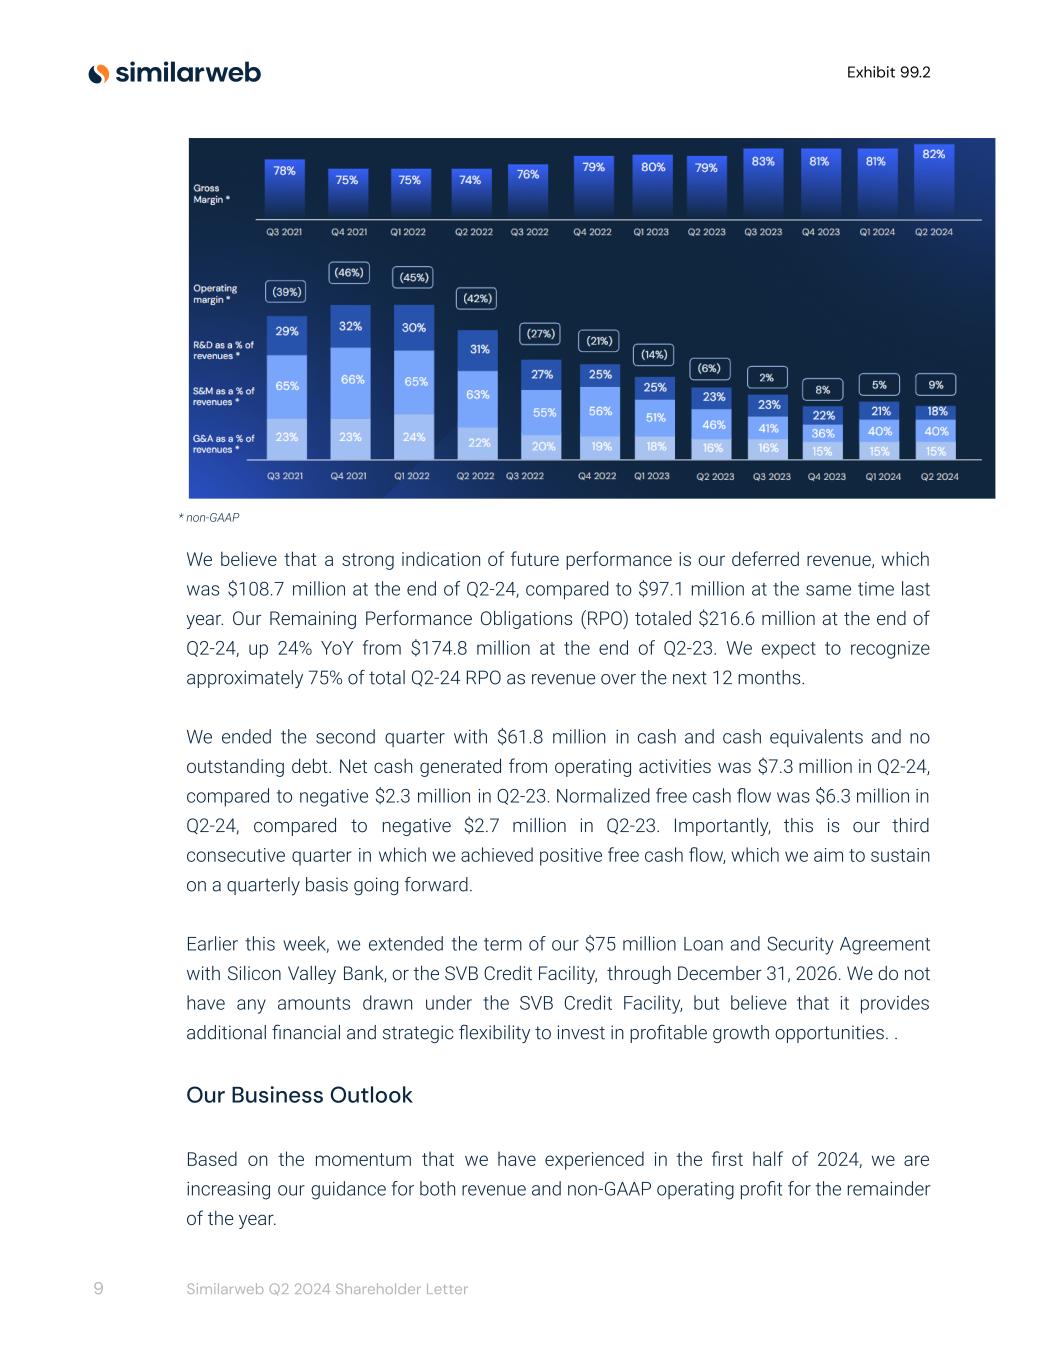
Exhibit 99.2 * non-GAAP We believe that a strong indication of future performance is our deferred revenue, which was $108.7 million at the end of Q2-24, compared to $97.1 million at the same time last year. Our Remaining Performance Obligations (RPO) totaled $216.6 million at the end of Q2-24, up 24% YoY from $174.8 million at the end of Q2-23. We expect to recognize approximately 75% of total Q2-24 RPO as revenue over the next 12 months. We ended the second quarter with $61.8 million in cash and cash equivalents and no outstanding debt. Net cash generated from operating activities was $7.3 million in Q2-24, compared to negative $2.3 million in Q2-23. Normalized free cash flow was $6.3 million in Q2-24, compared to negative $2.7 million in Q2-23. Importantly, this is our third consecutive quarter in which we achieved positive free cash flow, which we aim to sustain on a quarterly basis going forward. Earlier this week, we extended the term of our $75 million Loan and Security Agreement with Silicon Valley Bank, or the SVB Credit Facility, through December 31, 2026. We do not have any amounts drawn under the SVB Credit Facility, but believe that it provides additional financial and strategic flexibility to invest in profitable growth opportunities. . Our Business Outlook Based on the momentum that we have experienced in the first half of 2024, we are increasing our guidance for both revenue and non-GAAP operating profit for the remainder of the year. 9 Similarweb Q2 2024 Shareholder Letter
Exhibit 99.2 In the third quarter of 2024 (Q3-24), we expect total revenue in the range of $62.5 million to $63.0 million, representing approximately 15% YoY growth at the midpoint of the range. For the full year of 2024, we expect total revenue in the range of $246.0 million to $248.0 million, an increase from our previous expectation. We expect non-GAAP operating profit for Q3-24 to be in the range of $2.8 million to $3.2 million. For the full year of 2024, we expect non-GAAP operating profit to be between $13.0 million and $15.0 million, an increase from our previous expectation. Our guidance reflects an increase in operating expenses, primarily related to increased headcount, in which we intend to invest to further accelerate our revenue growth, while maintaining non-GAAP operating profit and positive free cash flow. We are focused on working to become a “Rule of 40” company on an annual basis over time and we aim to achieve non-GAAP operating profit and positive free cash flow in each quarter of 2024. Our Focus on Profitable Growth We continue to focus on generating profitable growth. At the beginning of the year, we shared with you our four strategic objectives for the year and are pleased at the progress that we have made during the first half of 2024: (1) We seek to land more new strategic accounts and to retain and expand our current strategic accounts. We are pleased with the continued growth of our $100,000 customer cohort, which now comprises 60% of our ARR as well as growing our first 8-figure ARR customer. (2) We are focused on increasing net retention across our existing customers. We are encouraged with the increase in NRR rates during the quarter and continue to invest in our customers’ success to drive further improvement in the quarters ahead. (3) We intend to continue to innovate across our product line. We are proud of our product and data innovation including the launch of SAM in Q1-24 and the new data version last month. The recent acquisitions of AdMetricks and 42matters will expand our solutions in both Ad Intelligence and App Intelligence and contribute to revenue growth once the respective post-merger integrations are completed. 10 Similarweb Q2 2024 Shareholder Letter
Exhibit 99.2 (4) We will continue to operate efficiently. We are enthused by the substantial improvement in our profit margins and growing free cash flow while accelerating revenue growth. As we shared with you previously, the global macroeconomic conditions may continue to present some challenges for our business and for our customers for the remainder of the year, but we believe that much of our strategic objectives to capture positive trends and improve our execution are within our control. We are proud of our dedicated global team who never cease to challenge one another to ideate, innovate and deliver. The results in the second quarter demonstrate our commitment to disciplined execution that continues to enable us to generate revenue growth and increase our customer base efficiently and profitably. We continue to make significant progress towards our long term profit and free cash flow margin targets and look forward to sharing our progress with you. As we like to say, we are still “just getting started”. Thank you for your continued support as a shareholder. Sincerely, Or Offer Founder and Chief Executive Officer Jason Schwartz Chief Financial Officer 11 Similarweb Q2 2024 Shareholder Letter
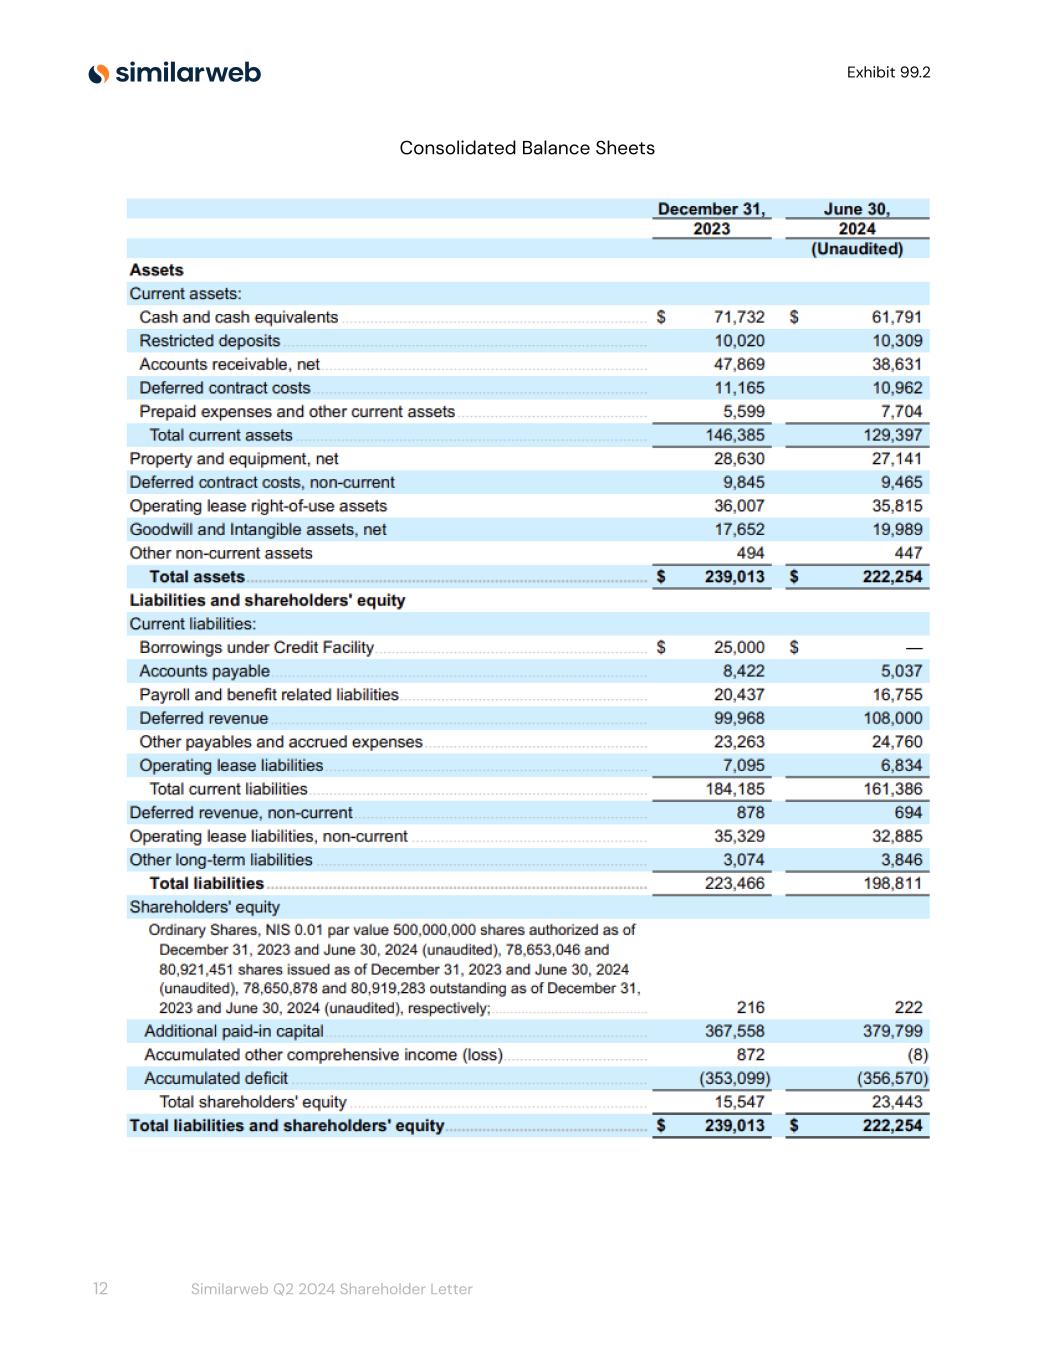
Exhibit 99.2 Consolidated Balance Sheets 12 Similarweb Q2 2024 Shareholder Letter

Exhibit 99.2 Consolidated Statements of Comprehensive Income (Loss) 13 Similarweb Q2 2024 Shareholder Letter
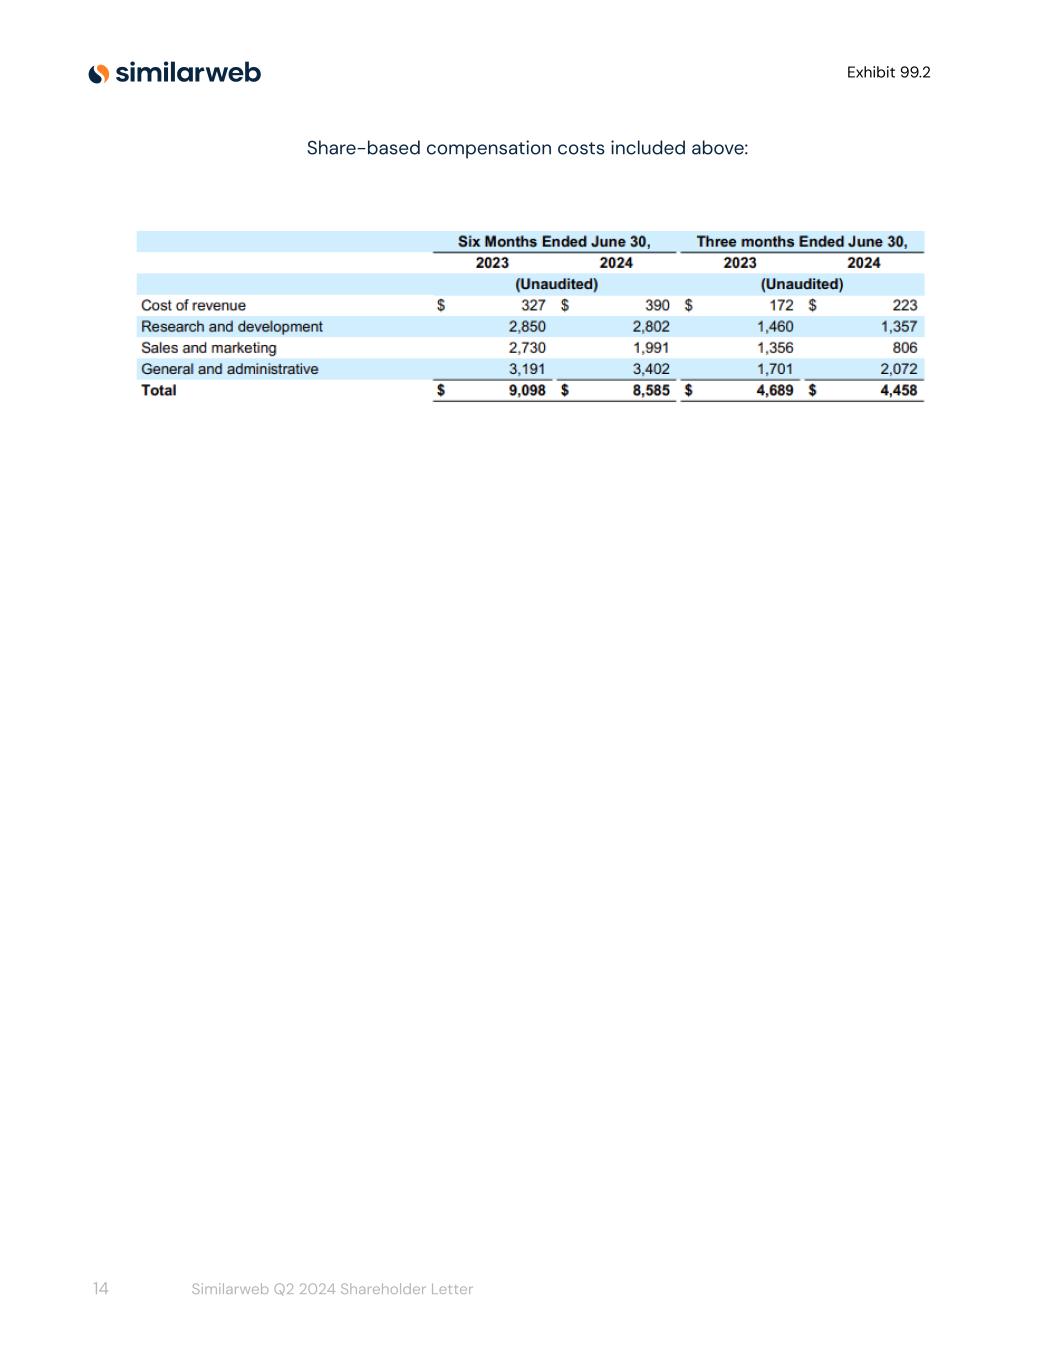
Exhibit 99.2 Share-based compensation costs included above: 14 Similarweb Q2 2024 Shareholder Letter
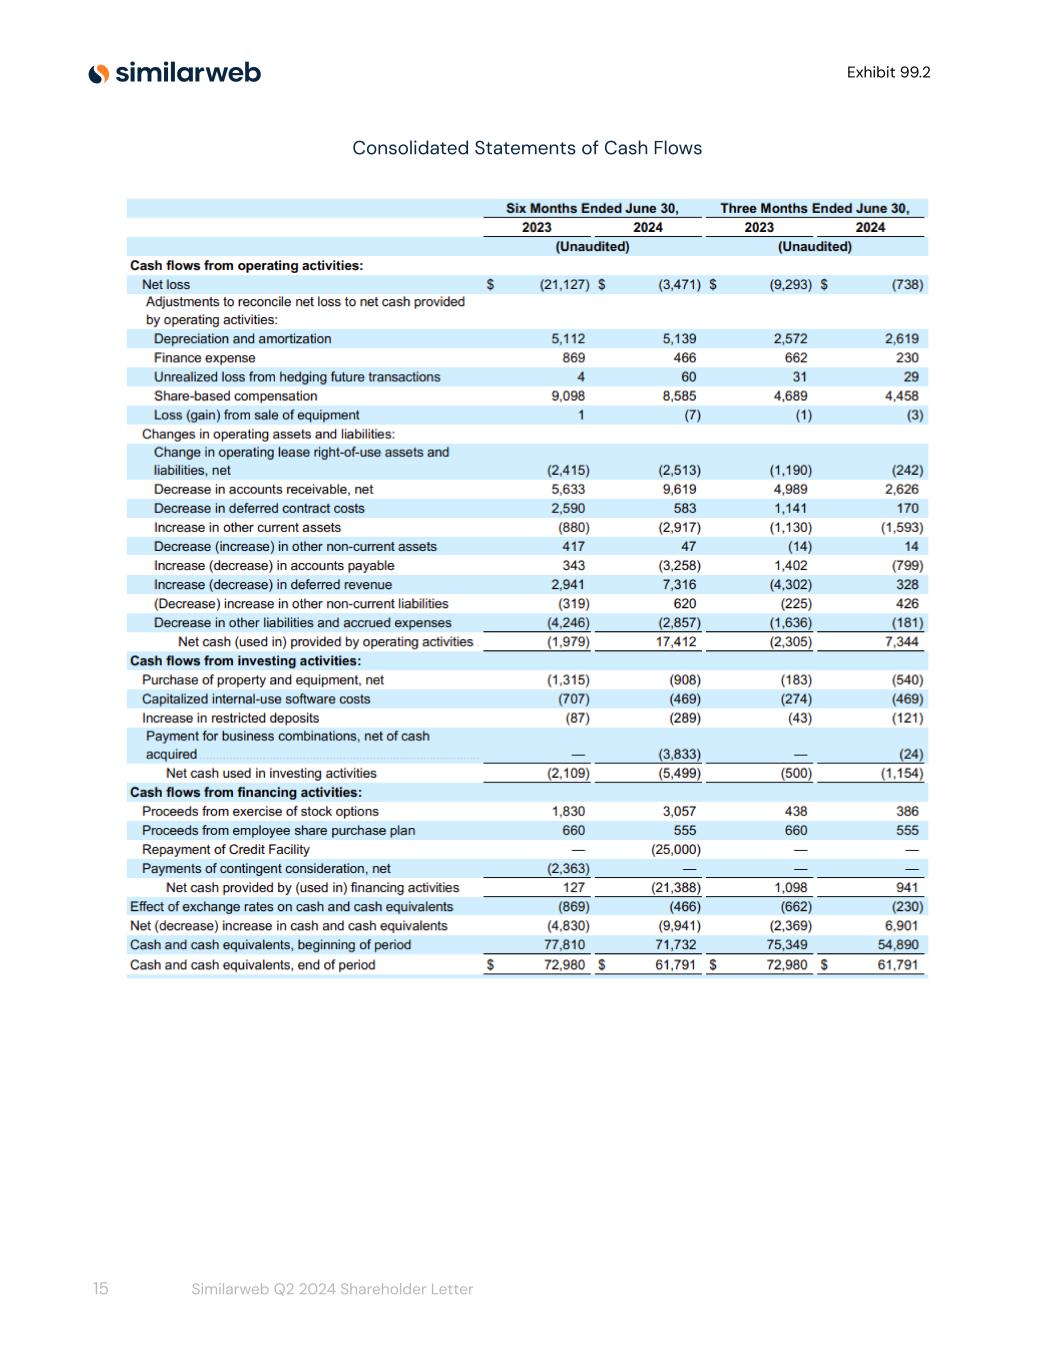
Exhibit 99.2 Consolidated Statements of Cash Flows 15 Similarweb Q2 2024 Shareholder Letter
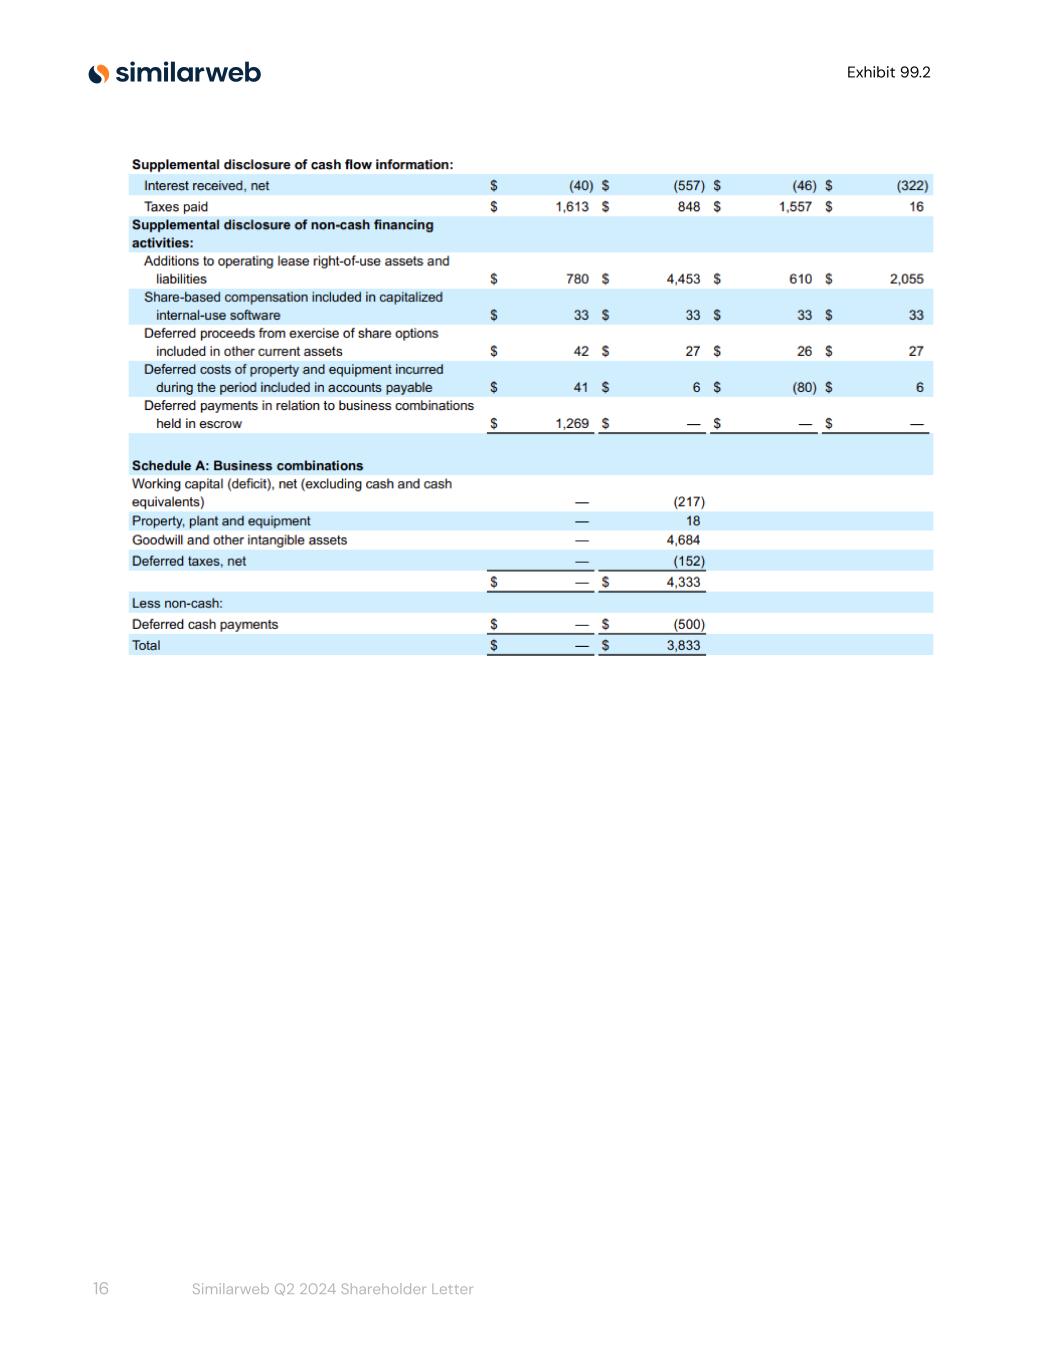
Exhibit 99.2 16 Similarweb Q2 2024 Shareholder Letter
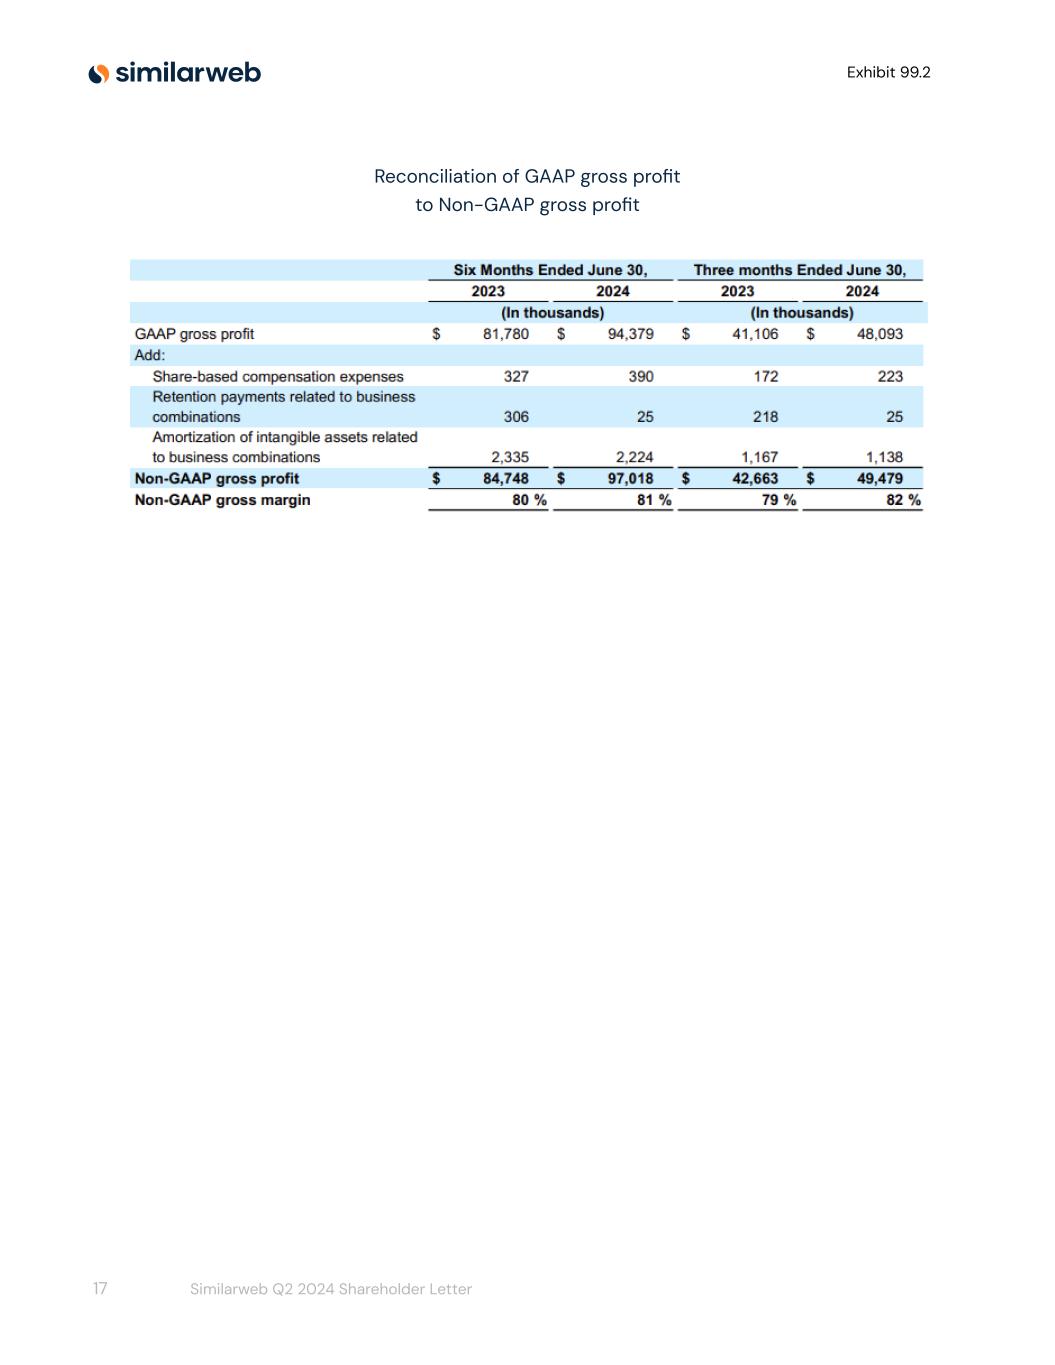
Exhibit 99.2 Reconciliation of GAAP gross profit to Non-GAAP gross profit 17 Similarweb Q2 2024 Shareholder Letter
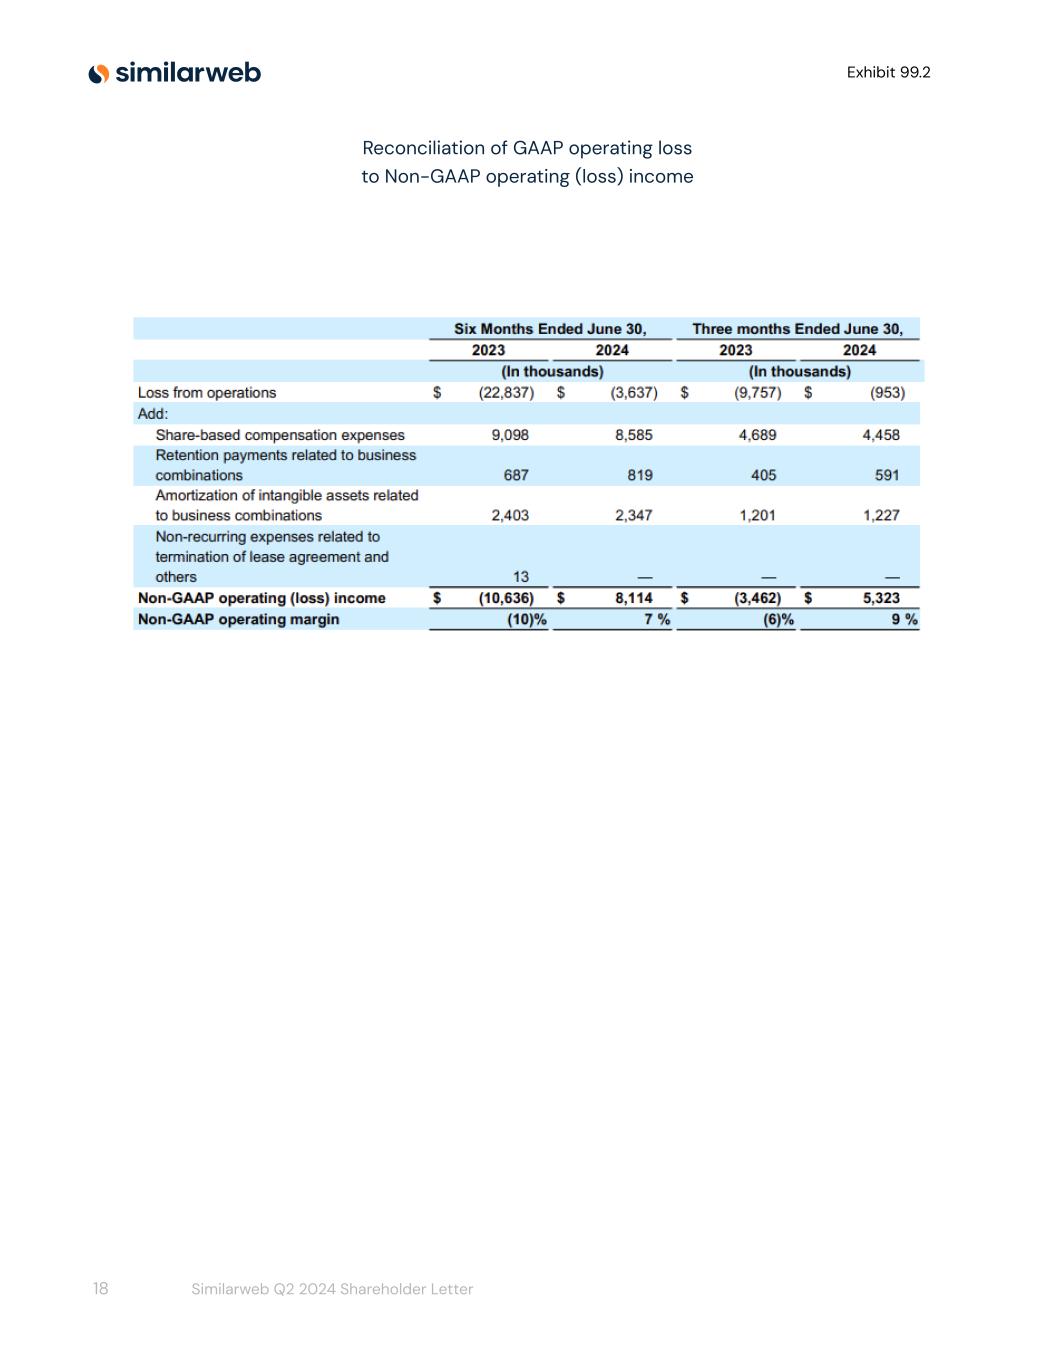
Exhibit 99.2 Reconciliation of GAAP operating loss to Non-GAAP operating (loss) income 18 Similarweb Q2 2024 Shareholder Letter
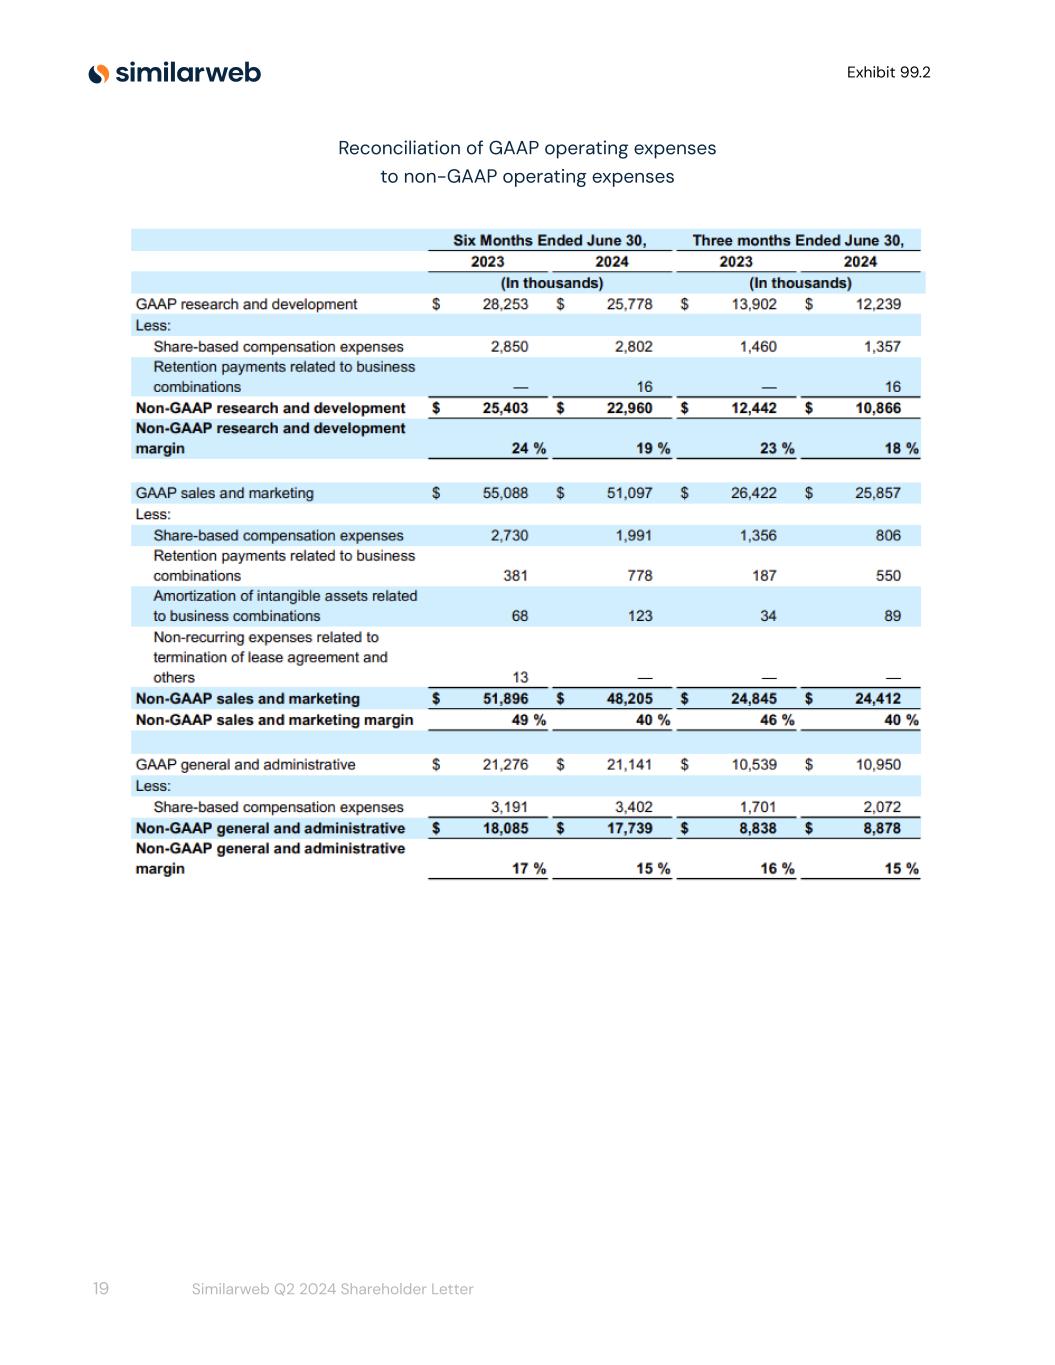
Exhibit 99.2 Reconciliation of GAAP operating expenses to non-GAAP operating expenses 19 Similarweb Q2 2024 Shareholder Letter
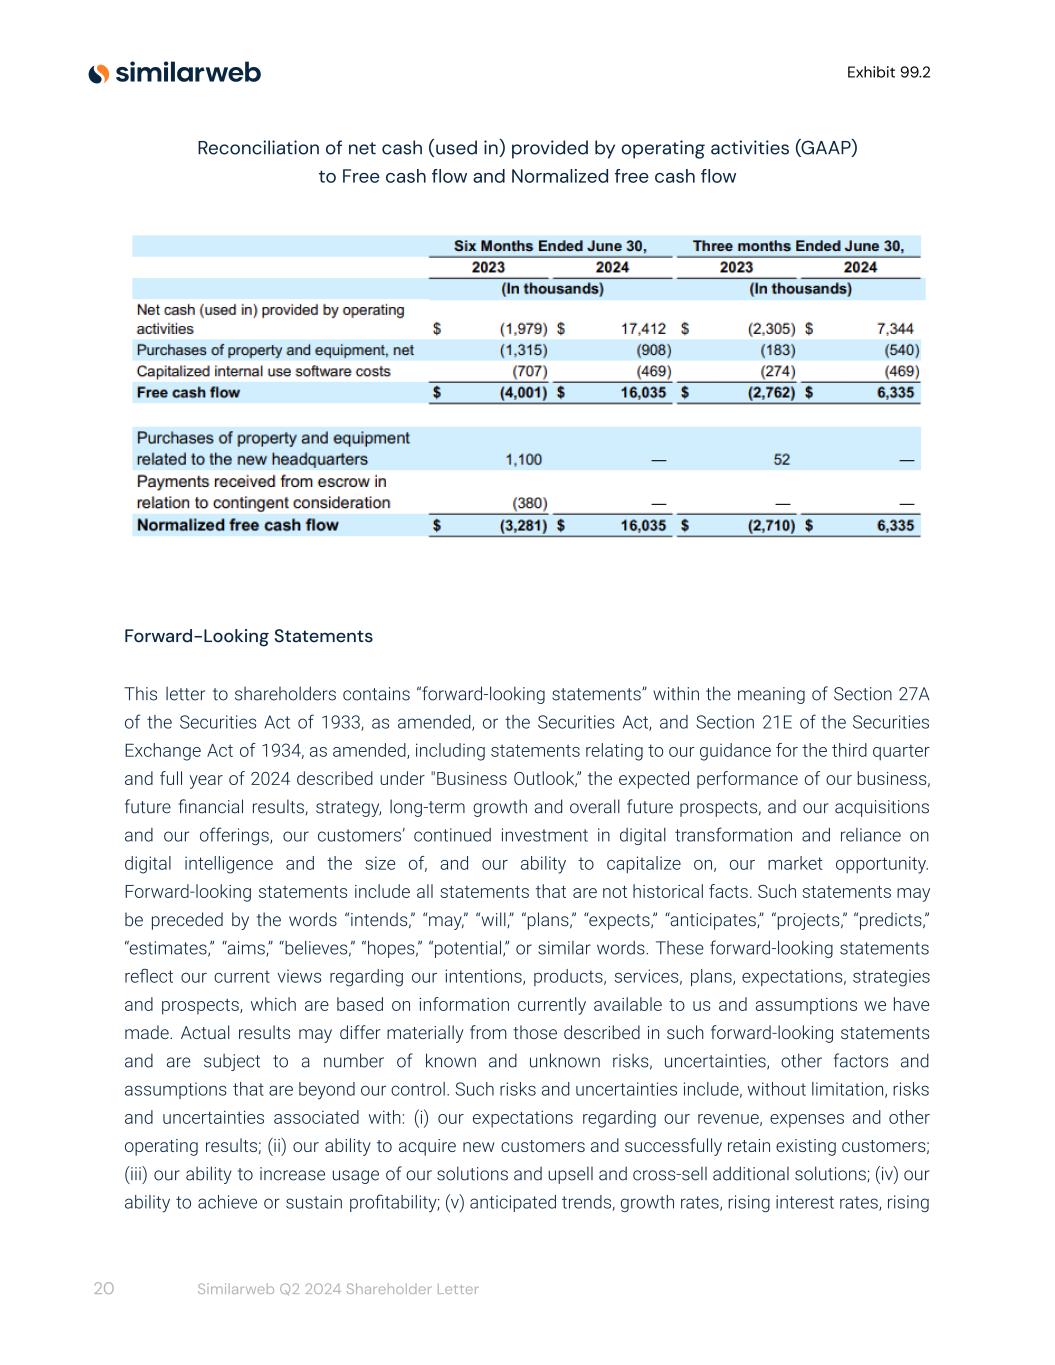
Exhibit 99.2 Reconciliation of net cash (used in) provided by operating activities (GAAP) to Free cash flow and Normalized free cash flow Forward-Looking Statements This letter to shareholders contains “forward-looking statements” within the meaning of Section 27A of the Securities Act of 1933, as amended, or the Securities Act, and Section 21E of the Securities Exchange Act of 1934, as amended, including statements relating to our guidance for the third quarter and full year of 2024 described under "Business Outlook,” the expected performance of our business, future financial results, strategy, long-term growth and overall future prospects, and our acquisitions and our offerings, our customers’ continued investment in digital transformation and reliance on digital intelligence and the size of, and our ability to capitalize on, our market opportunity. Forward-looking statements include all statements that are not historical facts. Such statements may be preceded by the words “intends,” “may,” “will,” “plans,” “expects,” “anticipates,” “projects,” “predicts,” “estimates,” “aims,” “believes,” “hopes,” “potential,” or similar words. These forward-looking statements reflect our current views regarding our intentions, products, services, plans, expectations, strategies and prospects, which are based on information currently available to us and assumptions we have made. Actual results may differ materially from those described in such forward-looking statements and are subject to a number of known and unknown risks, uncertainties, other factors and assumptions that are beyond our control. Such risks and uncertainties include, without limitation, risks and uncertainties associated with: (i) our expectations regarding our revenue, expenses and other operating results; (ii) our ability to acquire new customers and successfully retain existing customers; (iii) our ability to increase usage of our solutions and upsell and cross-sell additional solutions; (iv) our ability to achieve or sustain profitability; (v) anticipated trends, growth rates, rising interest rates, rising 20 Similarweb Q2 2024 Shareholder Letter

Exhibit 99.2 global inflation and current macroeconomic conditions, and challenges in our business and in the markets in which we operate, and the impact of Israel's war with Hamas and other terrorist organizations and potential hostilities with Iran or Lebanon on geopolitical and macroeconomic conditions or on our company and business; (vi) future investments in our business, our anticipated capital expenditures and our estimates regarding our capital requirements; (vii) the costs and success of our sales and marketing efforts and our ability to promote our brand; (viii) our reliance on key personnel and our ability to identify, recruit and retain skilled personnel; (ix) our ability to effectively manage our growth, including continued international expansion; (x) our reliance on certain third party platforms and sources for the collection of data necessary for our solutions; (xi) our ability to protect our intellectual property rights and any costs associated therewith; (xii) our ability to identify and complete acquisitions that complement and expand our reach and platform; (xiii) our ability to comply or remain in compliance with laws and regulations that currently apply or become applicable to our business, including in Israel, the United States, the European Union, the United Kingdom and other jurisdictions where we elect to do business; (xiv) our ability to compete effectively with existing competitors and new market entrants; and (xv) the growth rates of the markets in which we compete. These risks and uncertainties are more fully described in our filings with the Securities and Exchange Commission, including in the section entitled “Risk Factors” in our Form 20-F filed with the Securities and Exchange Commission on February 28, 2024, and subsequent reports that we file with the Securities and Exchange Commission. Moreover, we operate in a very competitive and rapidly changing environment. New risks emerge from time to time. It is not possible for our management to predict all risks, nor can we assess the impact of all factors on our business or the extent to which any factor, or combination of factors, may cause actual results to differ materially from those contained in any forward-looking statements we may make. In light of these risks, uncertainties, and assumptions, we cannot guarantee future results, levels of activity, performance, achievements, or events and circumstances reflected in the forward-looking statements will occur. Forward-looking statements represent our beliefs and assumptions only as of the date of this letter, August 6, 2024. Except as required by law, we undertake no duty to update any forward-looking statements contained in this letter as a result of new information, future events, changes in expectations, or otherwise. Certain information contained in this letter relates to or is based on studies, publications, surveys, and other data obtained from third-party sources and the Company's own internal estimates and research. While the Company believes these third-party sources to be reliable as of the date of this letter, it has not independently verified, and makes no representation as to the adequacy, fairness, accuracy, or completeness of any information obtained from third-party sources. In addition, all of the market data included in this letter involves a number of assumptions and limitations, and there can be no guarantee as to the accuracy or reliability of such assumptions. Finally, while we believe our own internal research is reliable, such research has not been verified by any independent source. 21 Similarweb Q2 2024 Shareholder Letter
Exhibit 99.2 Non-GAAP Financial Measures This letter to shareholders contains certain financial measures that are expressed on a non-GAAP basis. We use these non-GAAP financial measures internally to facilitate analysis of our financial and business trends and for internal planning and forecasting purposes. We believe these non-GAAP financial measures, when taken collectively, may be helpful to investors because they provide consistency and comparability with past financial performance by excluding certain items that may not be indicative of our business, results of operations, or outlook. However, non-GAAP financial measures have limitations as an analytical tool and are presented for supplemental informational purposes only. They should not be considered in isolation from, or as a substitute for, financial information prepared in accordance with GAAP. Free cash flow represents net cash provided by (used in) operating activities less capital expenditures and capitalized internal-use software costs. Normalized free cash flow represents free cash flow less capital investments related to the Company's headquarters, payments received in connection with these capital investments and deferred payments related to business combinations. Non-GAAP operating income (loss), non-GAAP operating margin, non-GAAP gross profit, non-GAAP gross margin, non-GAAP research and development expenses, non-GAAP sales and marketing expenses, and non-GAAP general and administrative expenses represents the comparable GAAP financial figures, less share-based compensation, adjustments, and payments related to business combinations, amortization of intangible assets, and certain other non-recurring items, as applicable and indicated in the above tables. Other Metrics Customer acquisition costs (CAC) represent the portion of sales and marketing expenses allocated to acquire new customers. Customer retention costs (CRC) represent the portion of sales and marketing expenses allocated to retain existing customers and to increase existing customers’ subscriptions. Annual recurring revenue (ARR) represents the annualized subscription revenue we would contractually expect to receive from customers assuming no increases or reductions in their subscriptions. CAC payback period is the estimated time in months to recover CAC in terms of incremental gross profit that newly acquired customers generate. Net retention rate (NRR) represents the comparison of our ARR from the same set of customers as of a certain point in time, relative to the same point in time in the previous year, expressed as a percentage. 22 Similarweb Q2 2024 Shareholder Letter